Category: performance

  • Google App Engine Performance Improvements

    Over the past few years, Webtide has been working closely with Google to improve the usage of Jetty in the App Engine Java Standard Runtime. We have updated the GAE Java21 Runtime to use Jetty 12 with support for both EE8 and EE10 environments. In addition, a new HttpConnector mode has been added to increase the performance of all Java Runtimes, this is expected to result in significant cost savings from less memory and CPU usage.

    Bypassing RPC Layer with HttpConnector Mode

    Recently, we implemented a new mode for the Java Runtimes which bypasses the legacy gRPC layer which was previously needed to support the GEN1 runtimes. This legacy code path allowed support of the GEN1 and GEN2 Runtimes simultaneously, but had significant overhead; it used two separate Jetty Servers, one for parsing HTTP requests and converting to RPC, and another using a custom Jetty Connector to allow RPC requests to be processed by Jetty. It also required the full request and response content to be buffered which further increased memory usage.

    The new HttpConnector mode completely bypasses this RPC layer, thereby avoiding the overhead of buffering full request and response contents. Additionally, it removes the necessity of starting a separate Jetty Server, further reducing overheads and streamlining the request-handling process.

    Benchmarks

    Benchmarks conducted on the new HttpConnector mode have demonstrated significant performance improvements. Detailed results and documentation of these benchmarks can be found here.

    Usage

    To take advantage of the new HttpConnector mode, developers can set the appengine.use.HttpConnector system property in their appengine-web.xml file.

    <system-properties>
        <property name="appengine.use.httpconnector" value="true"/>
    </system-properties>

    By adopting this configuration, developers can leverage the enhanced performance and efficiency offered by the new HttpConnector mode. This is available for all Java Runtimes from Java8 to Java21.

    This mode is currently an optional configuration but future plans are to make this the default for all applications.

  • If Virtual Threads are the solution, what is the problem?

    Java’s Virtual Threads (aka Project Loom or JEP 444) have arrived as a full platform feature in Java 21, which has generated considerable interest and many projects (including Eclipse Jetty) are adding support.

    I have previously been somewhat skeptical about how significant any advantages Virtual Threads actually have over Platform Threads (aka Native Threads). I’ve also pointed out that cheap Threads can do expensive things, so that using Virtual Threads may not be a universal panacea for concurrent programming.

    However, even with those doubts, it is clear that Virtual Threads do have advantages in memory utilization and speed of startup. In this blog we look at what kinds of applications may benefit from those advantages.

    In short we investigate what scalability problems are Virtual Threads the solution for.

    Axioms

    Firstly let’s agree on what is accepted about Virtual Thread usage:

    • Writing asynchronous code is extraordinary difficult. “Yeah I know” you say… yeah but no, it is harder than that! Avoiding the need to write application logic in asynchronous style is key to improving the quality and stability of an application. This blog is not generally advocating you write your applications in an asynchronous style.
    • Virtual Threads are very cheap to create. From a performance perspective there is no reason to pool already started Virtual Threads and such pools are considered an anti pattern. If a Virtual Thread is needed, then just create a new one.
    • Virtual Threads use less memory. This is accepted, but with some significant caveats. Specifically the memory saving is achieved because Virtual Threads only allocate stack memory as needed, whilst Platform Threads provision stack size based on a worst case maximal usage. This is not exactly an apples vs oranges comparison.

    If some are good, are more even better?

    Consider a blocking style application is running on a traditional application server that is not scaling sufficiently. On inspection you see that all the Threads in the pool (default size 200) are allocated and that there are no Threads available to do more work!

    Would making more Threads available be the solution to this scalability problem? Perhaps 2000 Platform Threads will help? Still slow? Let’s try 10,000 Platform Threads! Running out of memory? Then perhaps unlimited Virtual Threads will solve the scalability problems?

    What if on further inspection it is found that the pool Threads are mostly blocked waiting for a JDBC Database connection from the JDBC Connection Pool (default size 8) and that as a result the Thread pool is exhausted.

    If every request needs the database, then any additional Threads will all just block on the same JDBC pool, thus more Threads will not make a more Scalable solution.

    Alternatively, if only some requests need to use the database, then having more Threads would allow request that do not need the database to proceed to completion. However, a fraction of requests would still end up blocked on the JBDC pool. Thus any limited Platform Thread pool could still become exhausted.

    With unlimited Virtual Threads there is no effective limit on the number of Threads, so non database requests could always continue, but the queue of Threads waiting on JBDC would also be unlimited as would the total of any resources held by those Threads whilst waiting. Thus the application would only scale for some types of request, whilst giving JDBC dependent requests the same poor Quality of Service as before.

    Finite Resources

    If an application’s scalability is constrained by access to a finite resource, then it is unlikely that “more Threads” is the solution to any scalability problems. Just like you can’t solve traffic by adding cars to a congested road, adding Threads to an already busy server may make things worse.

    Some common examples of finite resources that applications can encounter are:

    • CPU: If the server CPU is near 100% utilization, then the existing number of Threads are sufficient to keep it fully loaded. More and/or faster CPUs are needed before any increase in Threads could be beneficial.
    • Database: Many database technologies cannot handle many concurrent requests, so parallelism is restricted. If the bottleneck is the database, then it needs to be re-engineered rather than laid siege to by more concurrent Threads.
    • Local Network: An application may block reading or writing data because it has reached the limit on the local network. In such cases, more Threads will not increase throughput, but they might improve latency if some threads can progress reading new requests and have responses ready to write once network becomes less congested. However there is a cost in waiting (see below).
    • Locks: Parallel applications often use some form of lock or mutual exclusion to serialize access to common data structures. Contention on those locks can limit parallelism and require redesign rather than just more Threads.
    • Caches: CPU, memory, file system and object caches are key tools in speeding up execution. However, if too many different tasks are executed concurrently, the capacity of these caches to hold relevant data may be exceeded and execution with a cold cache can be very slow. Sometimes it is better to do less things concurrently and serialize the excess so that caches can be more effective that trying to do everything at once.

    If an application’s lack of scalability is due to Threads waiting for finite resources, then any additional Threads (Platform or Virtual) are unlikely to help and may make your application less stable. At best, careful redesign is needed before Thread counts can be increased in any advantageous way.

    Infinite (OK Scalable) Resources

    Not all resources are finite and some can be considered infinite, at least for some purposes. But let’s call them “Scalable” rather than infinite. Examples of scalable resources that an application may block on include:

    • Database: Not all databases are created equal and some types of database have scalability in excess of the request rates experienced by a server. However, such scalability often comes at a latency cost as the database may be remote and/or distributed, thus applications may block waiting for the database, even if it has capacity to handle more requests in parallel.
    • Micro services: A scalable database is really just a specific example of a micro service that may be provided by a remote and/or distributed system that has effectively infinite capacity at the cost of some latency. Applications can often find themselves waiting on one or more such services.
    • Remote Networks: Local data center networks are often very VERY fast and in many situations they can outstrip even the combined capacity of many client systems. An application sending/receiving larger content may may block writing/reading them due to a slow client, but still have enough local network capacity to communicate with many other clients in parallel.
    • Local Filesystems: Typically file systems are faster than networks, but slower than CPU. They also may have significant latency vs throughput tradeoffs (less so now that drives seldom need to spin physical disks). Thus Threads may block on local IO even though there is additional capacity available.

    Applications that lack scalability due to Threads waiting for such scalable resources may benefit from more Threads. Whilst some Threads are waiting for the a database, micro service, slow client network or file system, it is likely that other Threads can progress even if they need to access the same types of resources.

    Platform Threads pools can easily be increased to many 1000’s or more before typical servers will have memory issues. If scalability is needed beyond that, then Virtual Threads can offer practically unlimited additional Thread, but see the caveats below.

    Furthermore, the fast starting Virtual Threads can be of significant benefit in situations where small jobs with long latency can be carried out in parallel. Consider an application that processes request using data from several micro services, each with some access latency. If these are done serially, then the total request latency is the summation of all. Sometimes asynchronous code is used to execute micro service request in parallel, but spinning up a couple of Virtual Threads in this situation is simpler, less error prone and applicable to more APIs.

    Too Much of a Good Thing?

    There is also some concern with low latency scalable resources that seldom block with Virtual Threads. Since Virtual Threads are not preempted, there can be starvation and/or fairness problems if they are not blocked by slow resources. This is probably a good problem to have, but will need some management on extreme scales for some applications.

    The Cost of Waiting

    We have identified that there are indeed scalable resources on which an application may wait with many Threads. However, there is no such thing as a free lunch and waiting Threads may have a significant cost, even if they are Virtual. Specifically how/where an application waits can greatly affect resource usage.

    Consider a traditional application server with a limited Thread pool that is running near capacity, but with additional demand. While the 200 odd Threads are busy handling 200 concurrent request, there are additional request waiting to be handled. However, in an asynchronous server like Jetty, those additional requests can be cheaply parked and may be represented just be a single set bit in a selector or perhaps a tiny entry in a queue that holds only a reference to a connection that is ready to be read.

    Now consider if requests were serviced by Virtual Threads instead of waiting for a pooled Platform Thread to become available. Pending requests would be allowed to proceed to some blocking point in the application. Waiting like this within the application can have additional expenses including:

    • An input buffer will be allocated to read the request and any content it has.
    • A read is performed into the input buffer, thus removing network back pressure so a client is enabled to send more request/data even if the server is unable to handle them.
    • An object representation of the request will be built, containing at least the meta data and frequently some application data if there is an XML or JSON payload
    • Sessions may be activated and brought into memory from caches or passivation stores.
    • The allocated Thread runs deep inside the application code, potentially reaching near maximal stack depth.
    • Application objects created on the heap are held in memory with references from the stack.
    • An output buffer may be allocated, along with additional character conversion resources.

    When request handling blocks within the application, all these additional resources may be allocated and held during that wait. Worse still, because of the lack of back pressure, a client may send more request/data resulting in more Threads and associated resources being allocated and also being held whilst the application waits for some resource.

    Provisioning for the Worst Case

    We have seen that there are indeed applications that may benefit from having additional Threads available to service requests. But we have also seen that such additional Threads may incur additional costs beyond just the stack size. Waiting/Blocking within an application will typically be done with a deep stack and other resources allocated. Whilst Virtual Threads might be effectively infinite, it is unlikely that these other required resources are equally scalable.

    When an application experiences a worst case peak in load, then ultimately some resource will run out. To provide good Quality of Service, it is vital that such resource exhaustion is handled gracefully, allowing some request handling to continue rather than suffering catastrophic failure.

    With traditional Platform Thread based pools, stack memory is already provisioned for worst case stacks for all Threads and the thread pool sized limit is also an indirect limit on the number of concurrent resources used. Threads have sufficient resources available to complete there handling whilst any excess requests suffer latency whilst waiting cheaply for an available Thread. Furthermore, the back pressure resulting from not reading all offered requests can prevent additional load from sent by the clients. Thread limits are imperfect resource limits, but at least they are some kind of limit that can provide some graceful degradation under load.

    Alternatively, an application using Virtual Threads that has no explicit resource management will be likely to exhaust some of the resources used by those Threads. This can result in an OutOfMemoryException or similar, as the unlimited Virtual Threads each allocate deep stacks and other resources needed for request handling. The cost of average memory savings may be insufficient provisioning for the worst case resulting in catastrophic failure rather than graceful degradation. An analogy is that building more roads can actually make traffic worse if the added cars overwhelm other infrastructure.

    Many applications are written without explicit resource limitations/management. Instead they rely on the imperfect Thread pool for at least some minimal protection. If that is removed, then some form of explicit resource limitation/management is likely to be needed in its place. Stable servers need to be provisioned for the worst case, not the average one.

    Conclusion

    There are applications that can scale better if more Threads are available, but it is not all applications (at least not without significant redesign). Consideration needs to be given to what will limit the worst case load for a server/application if it is not to be Threads. Specifically, the costs of waiting within the application may be such that scalability is likely to have a limit that will not be enforced by practically infinite Virtual Threads.

    It may be that resources have limitations well within the capacity of large but limited Platform Thread pools, which are perfectly capable of scaling to many thousands of threads. So experiments with scaling a Platform Thread pool should first be used to see what limits do apply to an application.

    If no upper limit is found before Platform Threads exhaust kernel memory, then Virtual Threads will allow scaling beyond that limit until some other limit is found. Thus the ultimate resource limit will need to be explicitly managed if catastrophic failure is to be avoided (but, to be fair, applications using Thread pools should also do some explicit resource limit management rather than rely just on the course limits of a Thread pool).

    Recommendation

    If Virtual Threads are not the general solution to scalability then what is? There is no one-size-fits-all solution, but I believe many applications that are limited by blocking on the network would benefit from being deployed in a server like Eclipse Jetty, that can do much of the handling for them asynchronously. Let Jetty read your requests asynchronously and prepare the content as parsed JSON, XML, or form data. Only then allocate a Thread (Virtual or Platform) with a large output buffer so the application can be written in blocking style, but will not block on either reading the request or writing the response. Finally, once the response is prepared, then let Jetty flush it to the network asynchronously. Jetty has always somewhat supported this model (e.g. by delaying dispatch to a Servlet until the first packet of data arrives), but with Jetty-12 we are adding more mechanisms to asynchronously prepare requests and flush responses, whilst leaving the application written in blocking style. More to come on this in future blogs!

  • Jetty 12 performance figures

    TL;DR

    This is a quick blog to share the performance figures of Jetty 12 and to compare them to Jetty 11, updated for the release of 12.0.2. The outcome of our benchmarks is that Jetty 12 with EE10 Servlet-6.0 is 5% percent faster than Jetty 11 EE9 Servlet-5.0. The Jetty-12 Core API is 22% faster.

    These percentages are calculated from the P99 integrals, which is the total latency excluding the 1% slowest requests from each of the 180 sample periods. The max latency for the 1% slowest requests in each sample shows a modest improvement for Jetty-12 servlets and a significant improvement for core.

    Introduction

    We use one server (powered by a 16 cores Intel Core i9-7960X) connected with a 10GbE link to a dedicated switch, upon which four clients are connected with a single 1GbE link each. The server runs a single instance of the Jetty Server running with the default of 200 threads and a 32 GB heap managed by ZGC, and the clients each run a single instance of the Jetty Load Generator running with an 8 GB heap also managed by ZGC. This is all automated, and the source of this benchmark is public too.

    Each client applies a load of 60,000 requests per second for a total of 240,000 requests per second that the server handles alone. We make sure there is no saturation anywhere: CPU consumption, network links, RAM, JVM heap, HTTP response status are monitored to ensure this is the case. We also make sure no errors are reported in HTTP response statuses or on the network interface.

    We collect all processing times of the Jetty Server (i.e.: the time it takes from reading the 1st byte of the request from the socket to writing the last byte of the response to the socket) in histograms from which we then graph the minimum, P99, and maximum latencies, and calculate integrals (i.e.: the sum of all measurements) for latter two.

    Jetty 12

    In the following three benchmarks, the CPU consumption of the server machine stayed around 40%.

    Below are plots of the maximum (graph in yellow), minimum to P99 (graph in red) processing times for Jetty 12:

    ee10

    The yellow graph shows a single early peak at 4500 µs, and then most peaks at less than 1000µs and an average sample peak of 434µs.

    The red graph shows a minimum processing time of 7 µs, a P99 processing time of 34.8 µs.

    core

    The yellow graph shows a few peaks at a 2000 µs with the average sample peak being 335µs.

    The red graph shows a minimum processing time of 6 µs, a P99 processing time of 30.0 µs.

    Comparing to Jetty 11

    Comparing apples to apples required us to slightly modify our benchmark to:

    In the following benchmark, the CPU consumption of the server machine stayed around 40%, like with Jetty 12.

    Below are the same plots of the maximum (graph in yellow), minimum to P99 (graph in red) processing times for Jetty 11:

    The yellow graph shows a few peaks at a 4000µs with an average sample peak of 487µs.

    The red graph shows a minimum processing time of 8 µs, a P99 processing time of 36.6 µs.

  • The Jetty Performance Effort

    One can only improve what can be reliably measured. To assert that Jetty’s performance is as good as it can be, doesn’t degrade over time and to facilitate future optimization work, we need to be able to reliably measure its performance.

    The primary goal

    The Jetty project wanted an automated performance test suite. Every now and then some performance measurements were done, with some ad-hoc tools and a lot of manual steps. In the past few months an effort has been made to try to come up with an automated performance test suite that could help us with the above goals and more, like making it easy to better visualize the performance characteristics of the tested scenarios for instance.

    We have been working on and off such test suite over the past few months. The primary goal was to write a reliable, fully automated test that can be used over time to measure, understand and compare performance over time.

    A basic load-testing scenario

    A test must be stable over time, and the same is true for performance tests: these ought to report stable performance over time to be considered repeatable. Since this is already a challenge in itself, we decided to start with the simplest possible scenario that is limited in realism but easy to grasp and still useful to get a quick overview of the server’s overall performance.

    The basis of that scenario is a simple HTTPS (i.e.: HTTP/1.1 over TLS) GET on a single resource that returns a few bytes of in-memory hard-coded data. To avoid a lot of complexity, the test is going to run on dedicated physical machines that are hosted in an environment entirely under our control. This way, it is easy to assert what kind of performance they’re capable of, that the performance is repeatable, that those machines are not doing anything else, that the network between them is capable enough and not overloaded, and so on.

    Load, don’t strangle

    As recommended in the Jetty Load Generator documentation, to get meaningful measurements we want one machine running Jetty (the server), one generating a fixed 100 requests/s load (the probe) and four machines each generating a fixed 60K requests/s load (the loaders). This setup is going to load Jetty with around 240K (4 loaders doing 60K each) requests per second, which is a good figure given the hardware we have: it was chosen based on the fact that it is enough traffic to get the server machine to burn around 50% of its total CPU time, i.e.: loading but not strangling it. The way we found this figure simply was by trial and error.

    Choosing a load that will not push the server to constant 100% CPU is important: while running a test that tries to run the heaviest possible load does have its use, such test is not a load test but a limit test. A limit test is good for figuring out how a software behave under a load too heavy for the hardware it runs on, for instance to make sure that it degrades gracefully instead of crashing and burning into flames when a certain limit is reached. But such test is of very limited use to figure out how fast your software responds under a manageable (i.e.: normal) load, which is what we are most commonly interested in.

    Planning the scenario

    The server’s code is pretty easy since it’s just about setting up Jetty: configuring the connector, SSL context and test handler is basically all it takes. For the loaders, the Jetty Load Generator is meant just for that task so it’s again fairly easy to write this code by making use of that library. The same is also true for the probe as the Jetty Load Generator can be used for it too, and can be configured to record each request’s latency too. And say we want to do that for three minutes to get a somewhat realistic idea of how the server does behave under a flat load.

    Deploying and running a test over multiple machines can be a daunting task, which is why we wrote the Jetty Cluster Orchestrator whose job is to make it easy to write some java code to distribute, execute and control it on a set of machines, using only the SSH protocol. Thanks to this tool, getting some code to run on the six necessary machines can be done simply while writing a plain standard JUnit test.

    So we basically have these three methods that we get running over the six machines:

    void startServer() { ... }
    
    void runProbeGenerator() { ... }
    
    void runLoadGenerator() { ... }

    We also need a warmup phase during which the test runs but no recording is made. The Jetty Load Generator is configured with a duration, so the original three minutes duration has to grow by that warmup duration. We decided to go with one minute for that warmup, so the total load generation duration is now four minutes. So both runProbeGenerator() and runLoadGenerator() are going to run for four minutes each. After the first minute, a flag is flipped to indicate the end of the warmup phase and to make the recording start. Once runProbeGenerator() and runLoadGenerator() return the test is over and the server is stopped then the recordings are collected and analyzed.

    Summarizing the test

    Here’s a summary of the procedure the test is implementing:

    1. Start the Jetty server on one server machine: call startServer().
    2. Start the Jetty Load Generator with a 100/s throughput on one probe machine: call runProbeGenerator().
    3. Start the Jetty Load Generator with a 60K/s throughput on four load machines: call runLoadGenerator().
    4. Wait one minute for the warmup to be done.
    5. Start recording statistics on all six machines.
    6. Wait three minutes for the run to be done.
    7. Stop the Jetty server.
    8. Collect and process the recorded statistics.
    9. (Optional) Perform assertions based on the recorded statistics.

    Results

    It took some iterations to get to the above scenario, and to get it to run repeatably. Once we got confident the test’s reported performance figures could be trusted, we started seriously analyzing our latest release (Jetty 10.0.2 at that time) with it.

    We quickly found a performance problem with a stack trace generated on the fast path, thanks to the Async Profiler’s flame graph that is generated on each run for each machine. Issue #6157 was opened to track this problem that has been solved and made it to Jetty 10.0.4.

    After spending more time looking at the reported performance, we noticed that the ByteBuffer pool we use by default is heavily contended and reported as a major time consumer by the generated flame graphs. Issue #6379 was opened to track this issue. A quick investigation of that code proved that minor modifications could provide an appreciable performance boost that made it to Jetty 10.0.6.

    While working on our backlog of general cleanups and improvements, issue #6322 made it to the top of the pile. Investigating it, it became apparent that we could improve the ByteBuffer pool a step further by adopting the RetainableByteBuffer interface everywhere in the input path and slightly modifying its contract, in a way that enabled us to write a much more performant ByteBuffer pool. This work was released as part of Jetty 10.0.7.

    Current status of Jetty’s performance

    Here are a few figures to give you some idea of what Jetty can achieve: while our test server (powered by a 16 cores Intel Core i9-7960X) is under a 240.000 HTTPS requests per second load, the probe measured that most of the time, 99% of its own HTTPS requests were served in less than 1 millisecond, as can be seen on this graph.

    Thanks to the collected measurements, we could add performance-related assertions to the test and made it run regularly against 10.0.x and 11.0.x to make sure performance won’t unknowingly degrade over time for those branches. We are now also running the same test over HTTP/1.1 clear text and TLS as well as HTTP/2.0 clear text and TLS too.

    The test also works against the 9.4.x branch but we do not yet have assertions for that branch because it has a different performance profile, so a different load profile is needed and different performance figures are to be expected. This has yet to happen but that is in our todo list.

    More test scenarios are going to be added to the test suite over time as we see fit. For instance, to measure certain load scenarios we deem important, to cover certain aspects or features or any other reason why we’d want to measure performance and ensure its stability over time.

    In the end, making Jetty as performant as possible and continuously optimizing it has always been on Webtide’s mind and that trend will continue in the future!

  • Introducing Jetty Load Generator

    The Jetty Project just released the Jetty Load Generator, a Java 11+ library to load-test any HTTP server, that supports both HTTP/1.1 and HTTP/2.
    The project was born in 2016, with specific requirements. At the time, very few load-test tools had support for HTTP/2, but Jetty’s HttpClient did. Furthermore, few tools supported web-page like resources, which were important to model in order to compare the multiplexed HTTP/2 behavior (up to ~100 concurrent HTTP/2 streams on a single connection) against the HTTP/1.1 behavior (6-8 connections). Lastly, we were more interested in measuring quality of service, rather than throughput.
    The Jetty Load Generator generates requests asynchronously, at a specified rate, independently from the responses. This is the Jetty Load Generator core design principle: we wanted the request generation to be constant, and measure response times independently from the request generation. In this way, the Jetty Load Generator can impose a specific load on the server, independently of the network round-trip and independently of the server-side processing time. Adding more load generators (on the same machine if it has spare capacity, or using additional machines) will allow the load against the server to increase linearly.
    Using this core principle, you can setup the load testing by having N load generator loaders that impose the load on the server, and 1 load generator probe that imposes a very light load and measures response times.
    For example, you can have 4 loaders that impose 20 requests/s each, for a total of 80 requests/s seen by the server. With this load on the server, what would be the experience, in terms of response times, of additional users that make requests to the server? This is exactly what the probe measures.
    If the load on the server is increased to 160 requests/s, what would the probe experience? The same response times? Worse? And what are the probe response times if the load on the server is increased to 240 requests/s?
    Rather than trying to measure some form of throughput (“what is the max number of requests/s the server can sustain?”), the Jetty Load Generator measures the quality of service seen by the probe, as the load on the server increases. This is, in practice, what matters most for HTTP servers: knowing that, when your server has a load of 1024 requests/s, an additional user can still see response times that are acceptable. And knowing how the quality of service changes as the load increases.
    The Jetty Load Generator builds on top of Jetty’s HttpClient features, and offers:

    • A builder-style Java API, to embed the load generator into your own code and to have full access to all events emitted by the load generator
    • A command-line tool, similar to Apache’s ab or wrk2, with histogram reporting, for ease of use, scripting, and integration with CI servers.

    Download the latest command-line tool uber-jar from: https://repo1.maven.org/maven2/org/mortbay/jetty/loadgenerator/jetty-load-generator-starter/

    $ cd /tmp
    $ curl -O https://repo1.maven.org/maven2/org/mortbay/jetty/loadgenerator/jetty-load-generator-starter/1.0.2/jetty-load-generator-starter-1.0.2-uber.jar
    

    Use the --help option to display the available command line options:

    $ java -jar jetty-load-generator-starter-1.0.2-uber.jar --help
    

    Then run it, for example:

    $ java -jar jetty-load-generator-starter-1.0.2-uber.jar --scheme https --host your_server --port 443 --resource-rate 1 --iterations 60 --display-stats
    

    You will obtain an output similar to the following:

    ----------------------------------------------------
    -------------  Load Generator Report  --------------
    ----------------------------------------------------
    https://your_server:443 over http/1.1
    resource tree     : 1 resource(s)
    begin date time   : 2021-02-02 15:38:39 CET
    complete date time: 2021-02-02 15:39:39 CET
    recording time    : 59.657 s
    average cpu load  : 3.034/1200
    histogram:
    @                     _  37 ms (0, 0.00%)
    @                     _  75 ms (0, 0.00%)
    @                     _  113 ms (0, 0.00%)
    @                     _  150 ms (0, 0.00%)
    @                     _  188 ms (0, 0.00%)
    @                     _  226 ms (0, 0.00%)
    @                     _  263 ms (0, 0.00%)
    @                     _  301 ms (0, 0.00%)
                       @  _  339 ms (46, 76.67%) ^50%
       @                  _  376 ms (7, 11.67%) ^85%
      @                   _  414 ms (5, 8.33%) ^95%
    @                     _  452 ms (1, 1.67%)
    @                     _  489 ms (0, 0.00%)
    @                     _  527 ms (0, 0.00%)
    @                     _  565 ms (0, 0.00%)
    @                     _  602 ms (0, 0.00%)
    @                     _  640 ms (0, 0.00%)
    @                     _  678 ms (0, 0.00%)
    @                     _  715 ms (0, 0.00%)
    @                     _  753 ms (1, 1.67%) ^99% ^99.9%
    response times: 60 samples | min/avg/50th%/99th%/max = 303/335/318/753/753 ms
    request rate (requests/s)  : 1.011
    send rate (bytes/s)        : 189.916
    response rate (responses/s): 1.006
    receive rate (bytes/s)     : 41245.797
    failures          : 0
    response 1xx group: 0
    response 2xx group: 60
    response 3xx group: 0
    response 4xx group: 0
    response 5xx group: 0
    ----------------------------------------------------
    

    Use the Jetty Load Generator for your load testing, and report comments and issues at https://github.com/jetty-project/jetty-load-generator. Enjoy!

  • Do Looms Claims Stack Up? Part 2: Thread Pools?

    “Project Loom aims to drastically reduce the effort of writing, maintaining, and observing high-throughput concurrent applications that make the best use of available hardware. … The problem is that the thread, the software unit of concurrency, cannot match the scale of the application domain’s natural units of concurrency — a session, an HTTP request, or a single database operation. …  Whereas the OS can support up to a few thousand active threads, the Java runtime can support millions of virtual threads. Every unit of concurrency in the application domain can be represented by its own thread, making programming concurrent applications easier. Forget about thread-pools, just spawn a new thread, one per task.” – Ron Pressler, State of Loom, May 2020

    In this series of blogs, we are examining the new Loom virtual thread features now available in OpenJDK 16 early access releases. In part 1 we saw that Loom’s claim of 1,000,000 virtual threads was true, but perhaps a little misleading, as that only applies to threads with near-empty stacks.  If threads actually have deep stacks, then the achieved number of virtual threads is bound by memory and is back to being the same order of magnitude as kernel threads.  In this part, we will further examine the claims and ramifications of Project Loom, specifically if we can now forget about Thread Pools. Spoiler: Cheap threads can do expensive things!
    All the code from this blog is available in our loom-trial project and has been run on my dev machine (Intel® Core™ i7-6820HK CPU @ 2.70GHz × 8, 32GB memory,  Ubuntu 20.04.1 LTS 64-bit, OpenJDK Runtime Environment (build 16-loom+9-316)) with no specific tuning and default settings unless noted otherwise. 

    Matching the scale?

    Project Loom makes the claim that applications need threads because kernel threads “cannot match the scale of the application domain’s natural units of concurrency”!
    Really???  We’ve seen that without tuning, we can achieve 32k of either type of thread on my laptop.  We think it would be fair to assume that with careful tuning, that could be stretched to beyond 100k for either technology.  Is this really below the natural scale of most applications?  How many applications have a natural scale of more than 32k simultaneous parallel tasks?  Don’t get me wrong, there are many apps that do exceed those scales and Jetty has users that put an extra 0 on that, but they are the minority and in reality very few applications are ever going to see that demand for concurrency.
    So if the vast majority of applications would be covered by blocking code with a concurrency of 32k, then what’s the big deal? Why do those apps need Loom? Or, by the same argument, why would they need to be written in asynchronous style?
    The answer is that you rarely see any application deployed with 10,000s of threads; instead, threads are limited by a thread pool, typically to 100s or 1000s of threads.  The default thread pool size in jetty is 200, which we sometimes see increased to 1000s, but we have never seen a 32k thread pool even though my un-tuned laptop could supposedly support it!
    So what’s going on? Why are thread pools typically so limited and what about the claim that Loom means we can “Forget about thread pools”?

    Why Thread Pools?

    One reason we are told that thread pools are used is because kernel threads are slow to start, thus having a bunch of them pre-started, waiting for a task in a pool improves latency.  Loom claims their virtual threads are much faster to start, so let’s test that with StartThreads, which reports:

    kStart(ns) ave:137,903 from:1,000 min:47,466 max:6,048,540
    vStart(ns) ave: 10,881 from:1,000 min: 4,648 max:  486,078

    So that claim checks out. Virtual threads start an order of magnitude faster than kernel threads.  If start time was the only reason for thread pools, then Loom’s claim of forgetting about thread pools would hold.
    But start time only explains why we have thread pools, but it doesn’t explain why thread pools are frequently sized far below the systems capacity for threads: 100s instead of 10,000s?  What is the reason that thread pools are sized as they are?

    Why Small Thread Pools?

    Giving a thread a task to do is a resource commitment. It is saying that a flow of control may proceed to consume CPU, memory and other resources that will be needed to run to completion or at least until a blocking point, where it can wait for those resources.  Most of those resources are not on the stack,  thus limiting the number of available threads is a way to limit a wide range of resource consumption and give quality of service:

    • If your back-end services can only handle 100s of simultaneous requests, then a thread pool with 100s of threads will avoid swamping them with too much load. If your JDBC driver only has 100 pooled connections, then 1,000,000 threads hammering on those connections or other locks are going to have a lot of contention.
    • For many applications a late response is a wrong response, thus it may well be better to handle 1000 tasks in a timely way with the 1001st task delayed, rather than to try to run all 1001 tasks together and have them all risk being late.
    • Graceful degradation under excess load.  Processing a task will need to use heap memory and if too much memory is demanded an OutOfMemeoryException is fatal for all java applications.  Limiting the number of threads is a coarse grained way of limiting a class of heap usage.  Indeed in part 1, we saw that it was heap memory that limited the number of virtual threads.

    Having a limited thread pool allows an application to be tested to that limit so that it can be proved that an application has the memory and other resources necessary to service all of those threads.  Traditional thinking has been that if the configured number of threads is insufficient for the load presented, then either the excess load must wait, or the application should start using asynchronous techniques to more efficiently use those threads (rather than increase the number of threads beyond the resource capacity of the machine).
    A limited thread pool is a coarse grained limit on all resources, not only threads.  Limiting the number of threads puts a limit on concurrent lock contention, memory consumption and CPU usage.

    Virtual Threads vs Thread Pool

    Having established that there might be some good reasons to use thread pools, let’s see if Loom gives us any good reasons not to use them?   So we have created a FakeDataBase class which simulates a JDBC connection pool of 100 connections with a semaphore and then in ManyTasks we run 100,000 tasks that do 2 selects and 1 insert to the database, with a small amount of CPU consumed both with and without the semaphore acquired.   The core of the thread pool test is:

     for (int i = 0; i < tasks; i++)
       pool.execute(newTask(latch));

    and this is compared against the Loom virtual thread code of:

     for (int i = 0 ; i < tasks; i++)
       Thread.builder().virtual().task(newTask(latch)).start();

    And the results are…. drum roll… pretty much the same for both types of thread:

    Pooled  K Threads 33,729ms
    Spawned V Threads 34,482ms

    The pooled kernel thread does appear to be consistently a little bit better, but this test is not that rigorous so let’s call it the same, which is kind of expected as the total duration is pretty much going to be primarily constrained by the concurrency of the database.
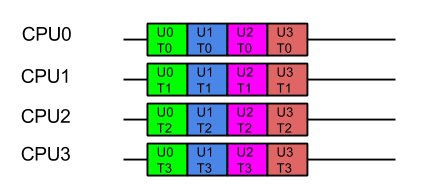
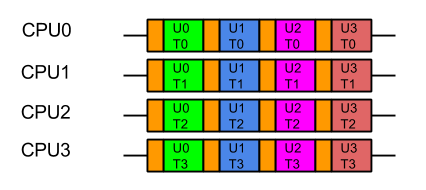
    So were there any difference at all?  Here is the system monitor graph during both runs: kernel threads with a pool are the left hand first period (60-30s) and then virtual threads after a change over peak (30s – 0s):

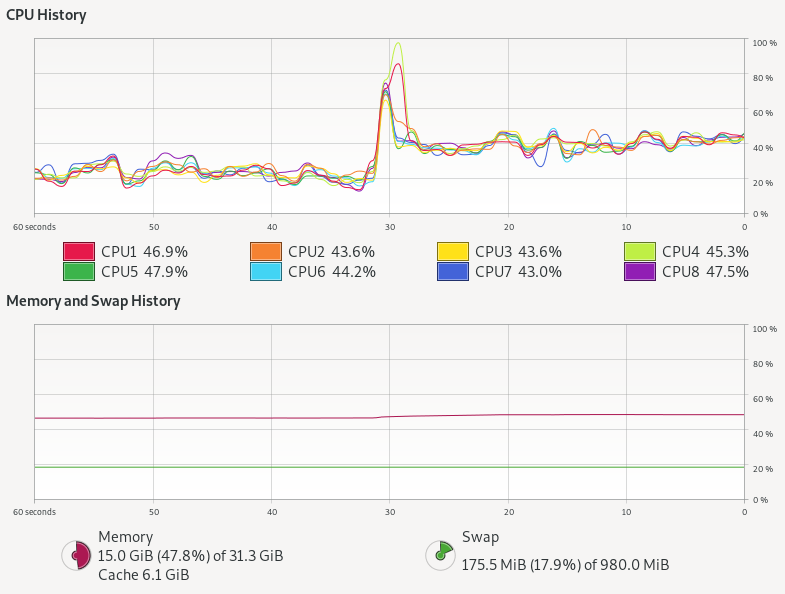
    Kernel threads with thread pool do not stress the CPU at all, but virtual threads alone use almost twice as much CPU! There is also a hint of more memory being used.
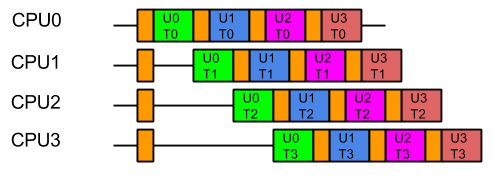
    The thread pool has 100k tasks in the thread pool queue, 100 kernel threads that take tasks, 100 at a time, and each task takes one of 100 semaphores permits 3 times, with little or no contention.
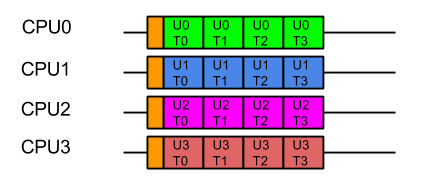
    The Loom approach has 100k independent virtual threads that each contend 3 times for the 100 semaphore permits, with up to 99,900 threads needing to be added then removed 3 times from the semaphore’s wake up queue.  The extra queuing for virtual threads could easily explain the excess CPU needed, but more investigation is needed to be definitive.
    However, tasks limited by a resource like JDBC are not really the highly concurrent tasks that Loom is targeted at.  To truly test Loom (and async), we need to look at a type of task that just won’t scale with blocking threads dispatched from a thread pool.

    Virtual Threads vs Async APIs

    One highly concurrent work load that we often see on Jetty is chat room style interaction (or games) written on CometD and/or WebSocket.  Such applications often have many 10,000s or even 100,000s of connections to the server that are mostly idle, waiting for a message to receive or an event to send. Currently we achieve these scales only by asynchronous threadless waiting, with all its ramifications of complex async APIs into the application needing async callbacks.  Luckily, CometD was originally written when there was only async servlets and not async IO, thus it still has the option to be deployed using blocking I/O reads and writes.  This gives it good potential to be a like for like comparison between async pooled kernel threads vs blocking virtual threads.
    However, we still have a concern that this style of application/load will not be suitable for Loom because each message to a chat room will fan out to the 10s, 100s or even 1000s of other users waiting in that room.  Thus a single read could result in many blocking write operations, which are typically done with deep stacks (parsing, framework, handling, marshalling, then writing) and other resources (buffers, locks etc). You can see in the following flame graph from a CometD load test using Loom virtual threads, that even with a fast client the biggest block of time is spent in the blue peak on the left, that is writing with deep stacks. It is this part of the graph that needs to scale if we have either more and/or slower clients:

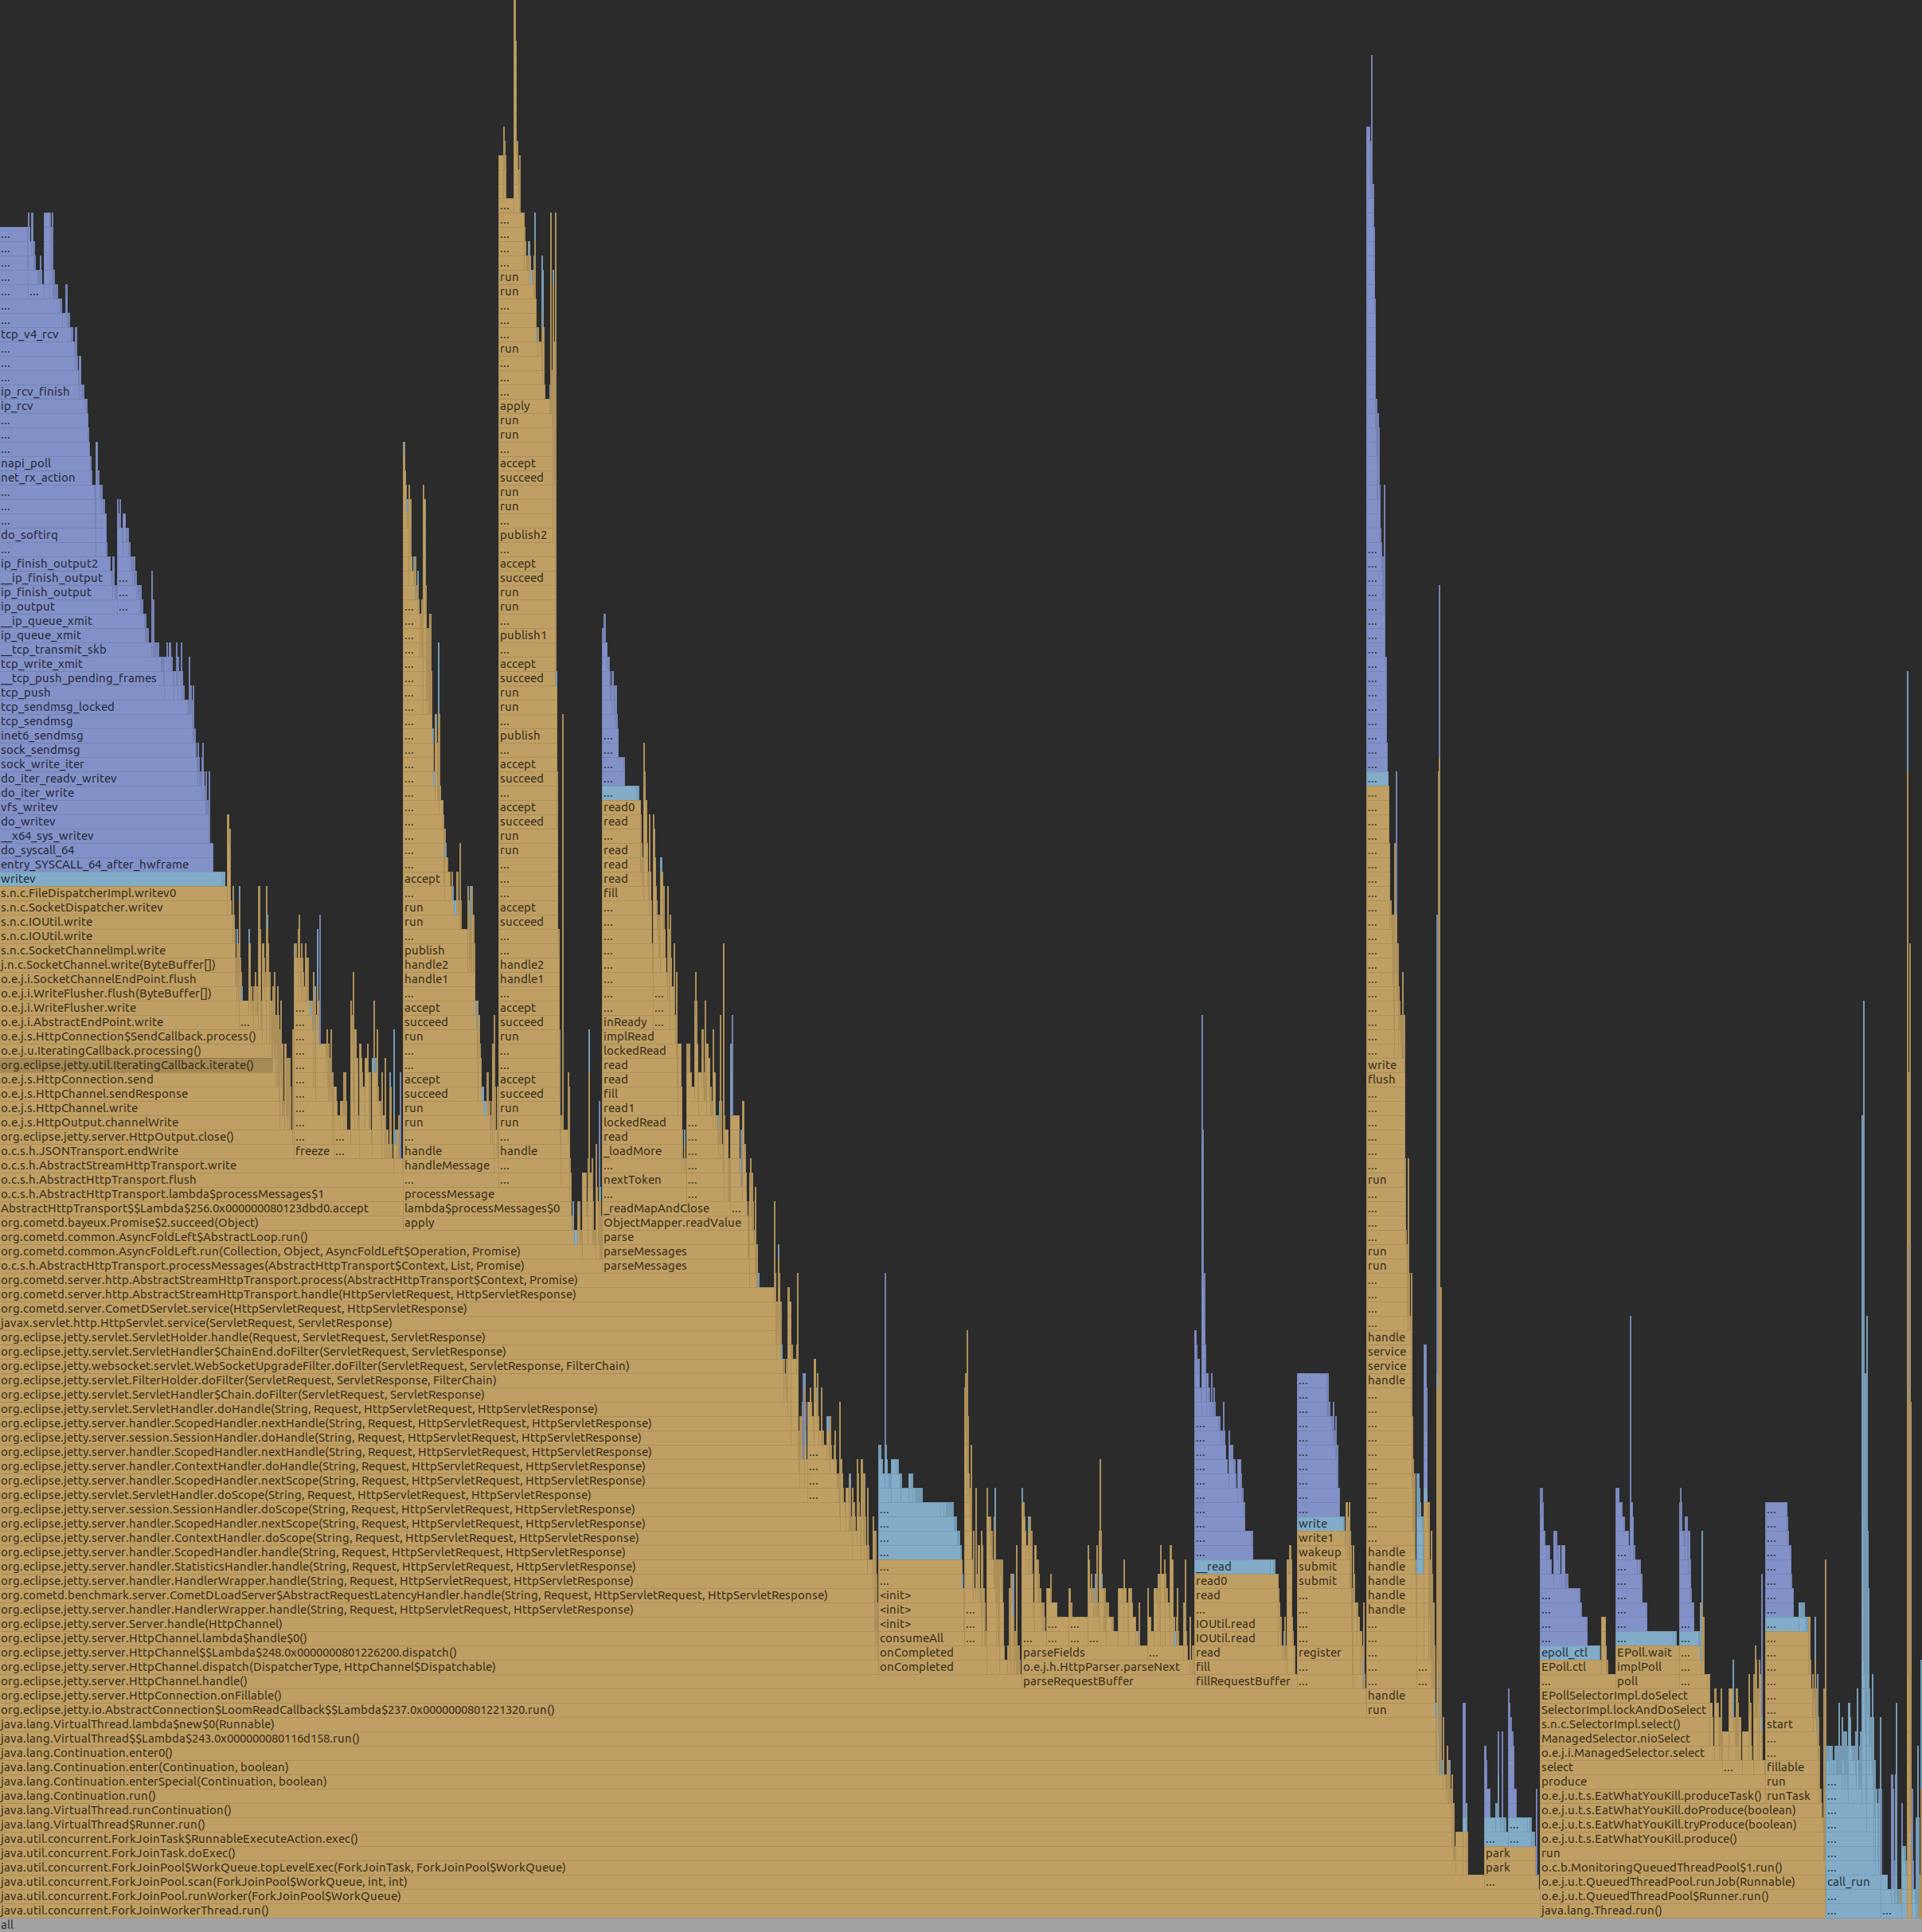
    Jetty with CometD chat on Loom

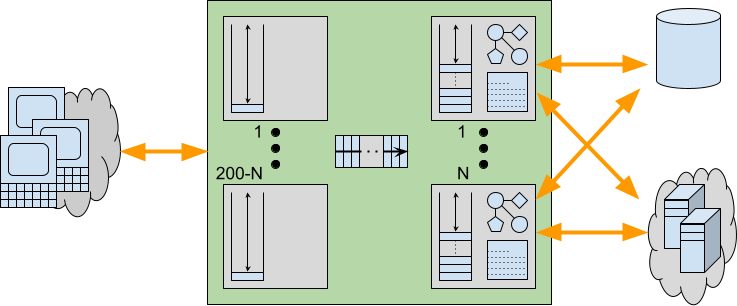
    To fairly test Loom, it is not sufficient to just replace the limited pool of kernel threads with infinite virtual threads.  Jetty goes to lots of effort with its eat what you kill scheduling using reserved threads to ensure that whenever a selector thread calls a potentially blocking task, another selector thread has been executed.  We can’t just put Loom virtual threads on top of this, else it will be paying the cost and complexity of core Jetty plus the overheads of Loom.  Moreover, we have also learnt the risk of Thread Starvation that can result in highly concurrent applications if you defer important tasks (e.g. HTTP/2 flow control).  Since virtual threads can be postponed (potentially indefinitely) by CPU bound applications or the use of non-Loom-aware locks (such as the synchronized keyword), they are not suitable for all tasks within Jetty.
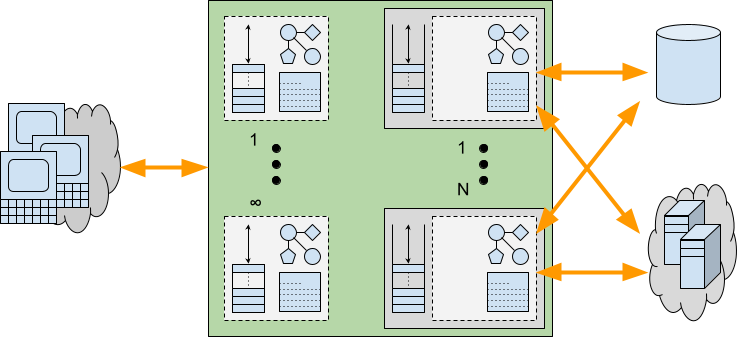
    Thus we think a better approach is to keep the core of Jetty running on kernel threads, but to spawn a virtual thread to do the actual work of reading, parsing, and calling the application and writing the response.  If we flag those tasks with InvocationType.NON_BLOCKING, then they will be called directly by the selector thread, with no executor overhead. These tasks can then spawn a new virtual thread to proceed with the reading, parsing,  handling, marshalling, writing and blocking.  Thus we have created the jetty-10.0.x-loom branch, to use this approach and hopefully give a good basis for fair comparisons.
    Our initial runs with our CometD benchmark with just 20 clients resulted in long GCs followed by out of memory failures! This is due to the usage of ThreadLocal for gathering latency statistics and each virtual thread was creating a latency capture data structure, only to use it once and then throw it away!  While this problem is solvable by changing the CometD benchmark code, it reaffirms that threads use resources other than stack and that Loom virtual threads are not a drop in replacement for kernel threads.
    We are aware that the handling of ThreadLocal is a well known problem in Loom, but until solved it may be a surprisingly hard problem to cope with, since you don’t typically know if a library your application depends on uses ThreadLocal or not.
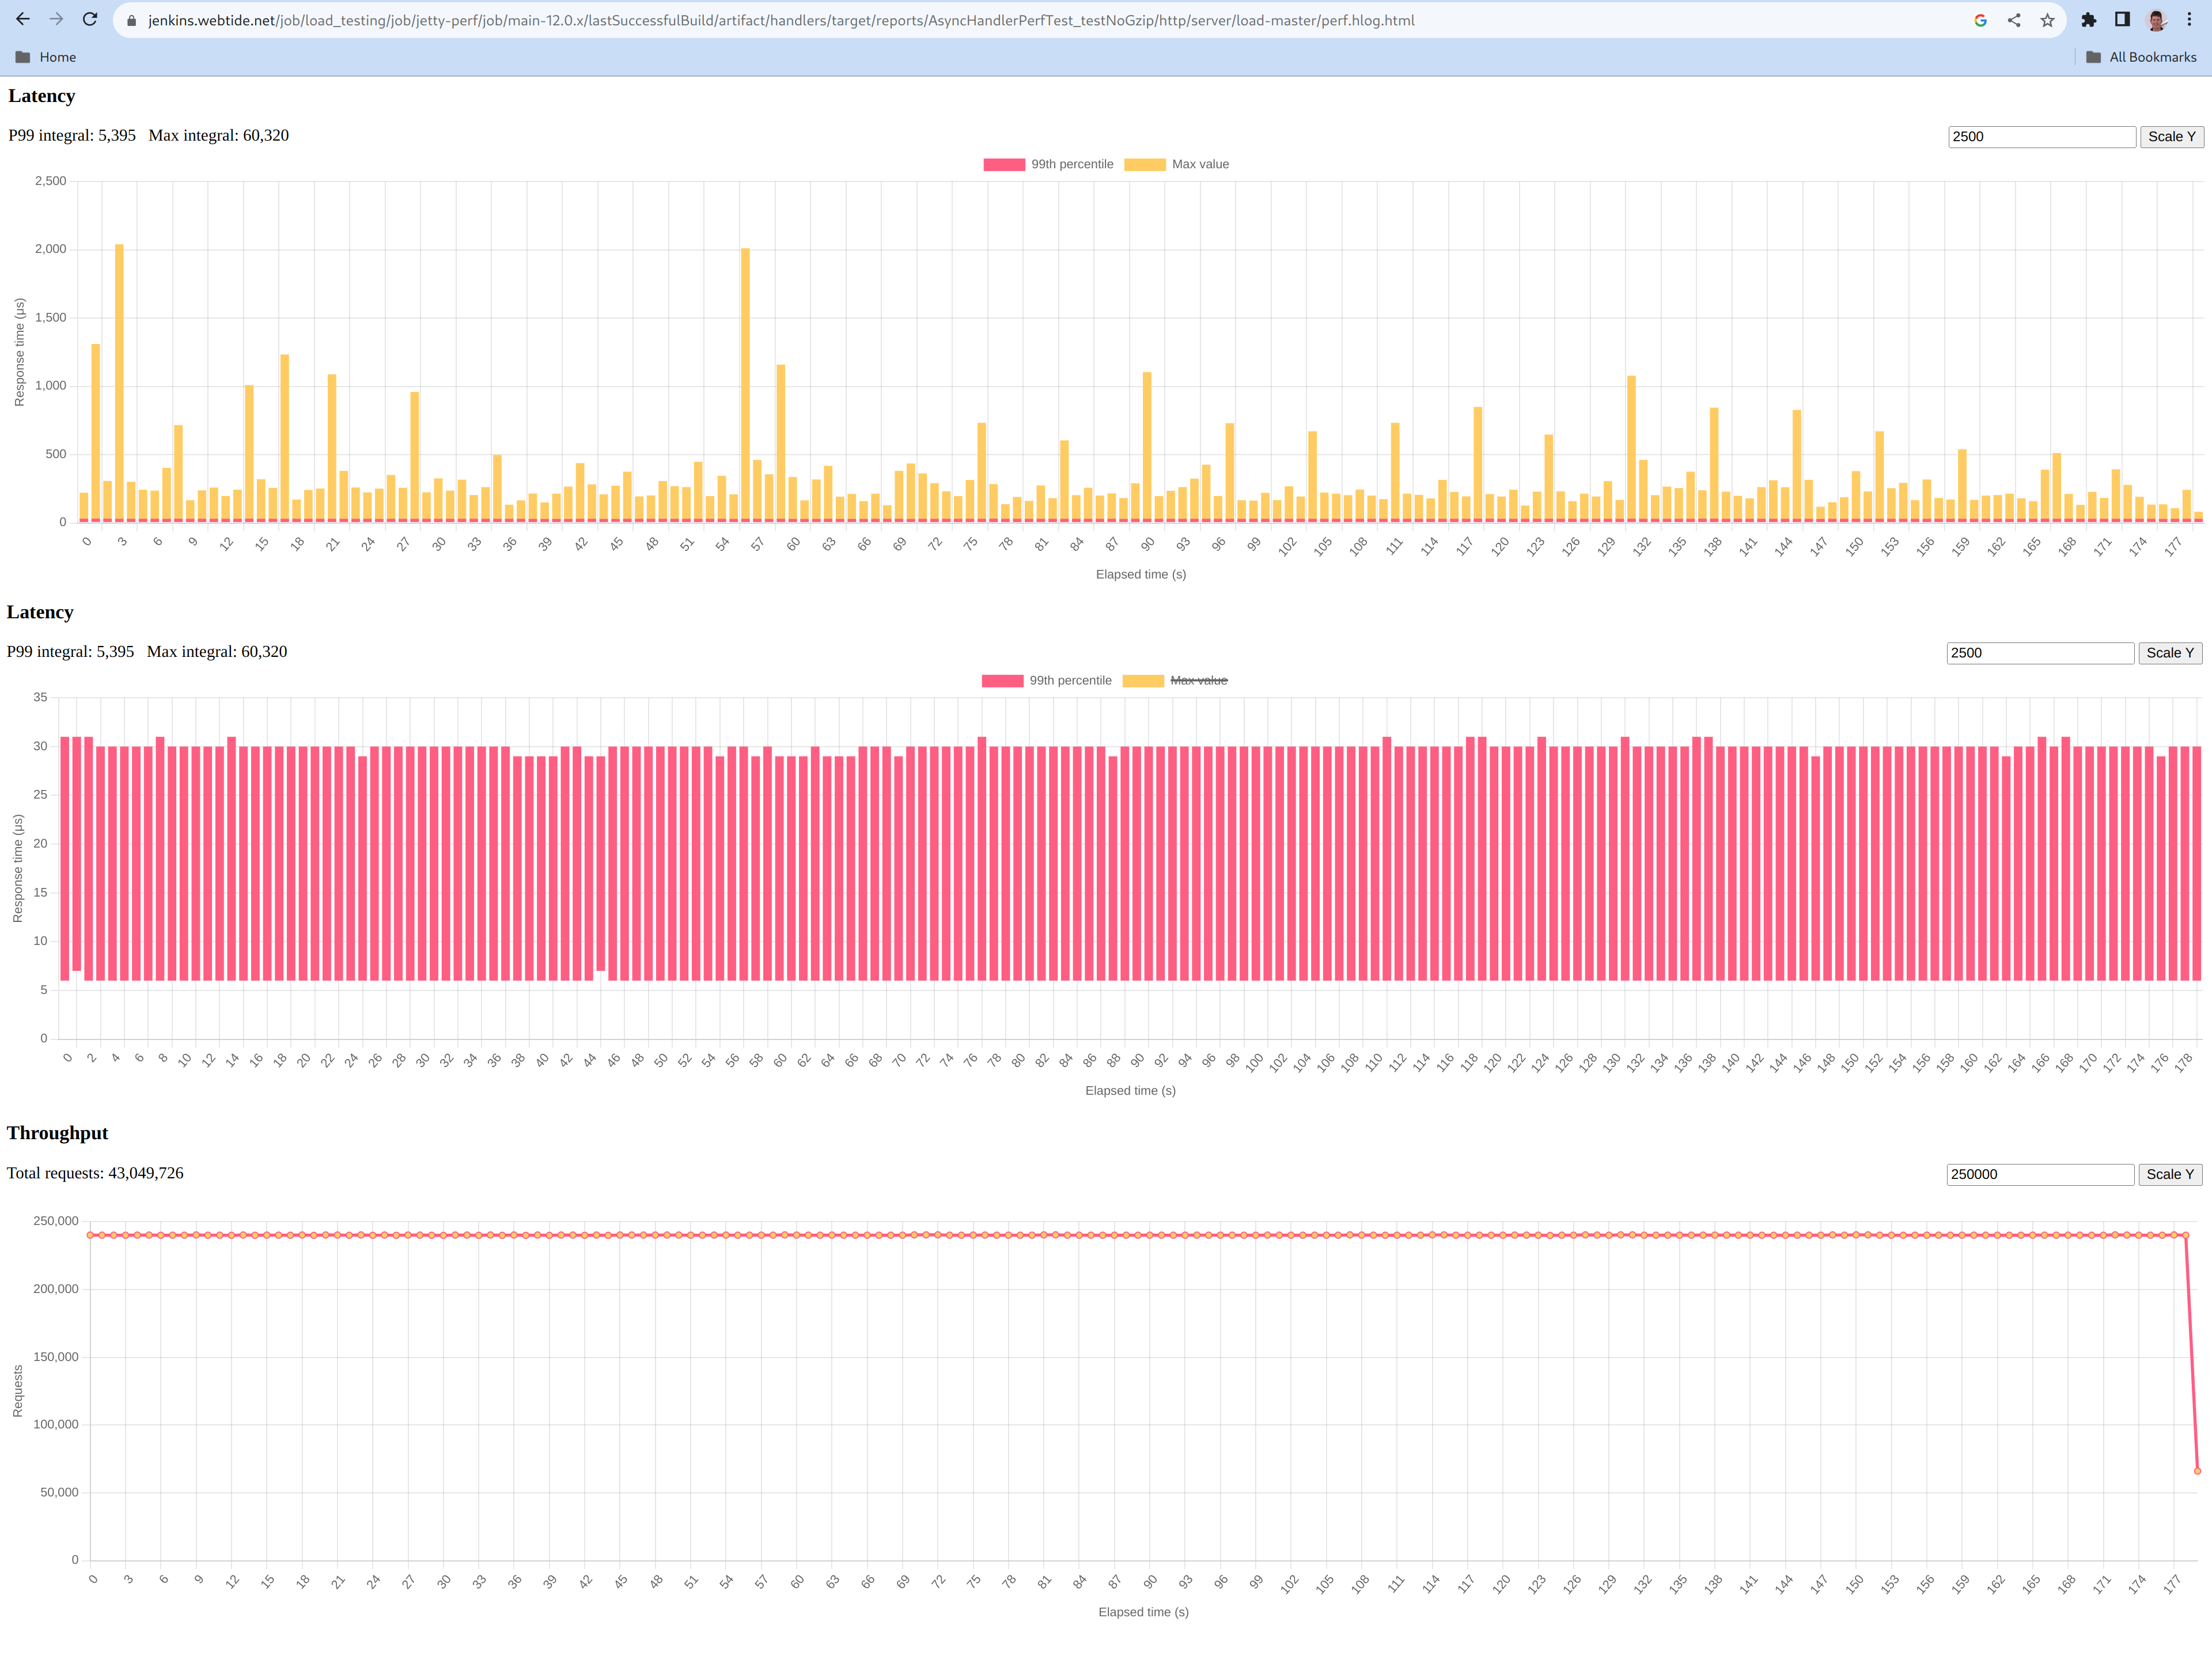
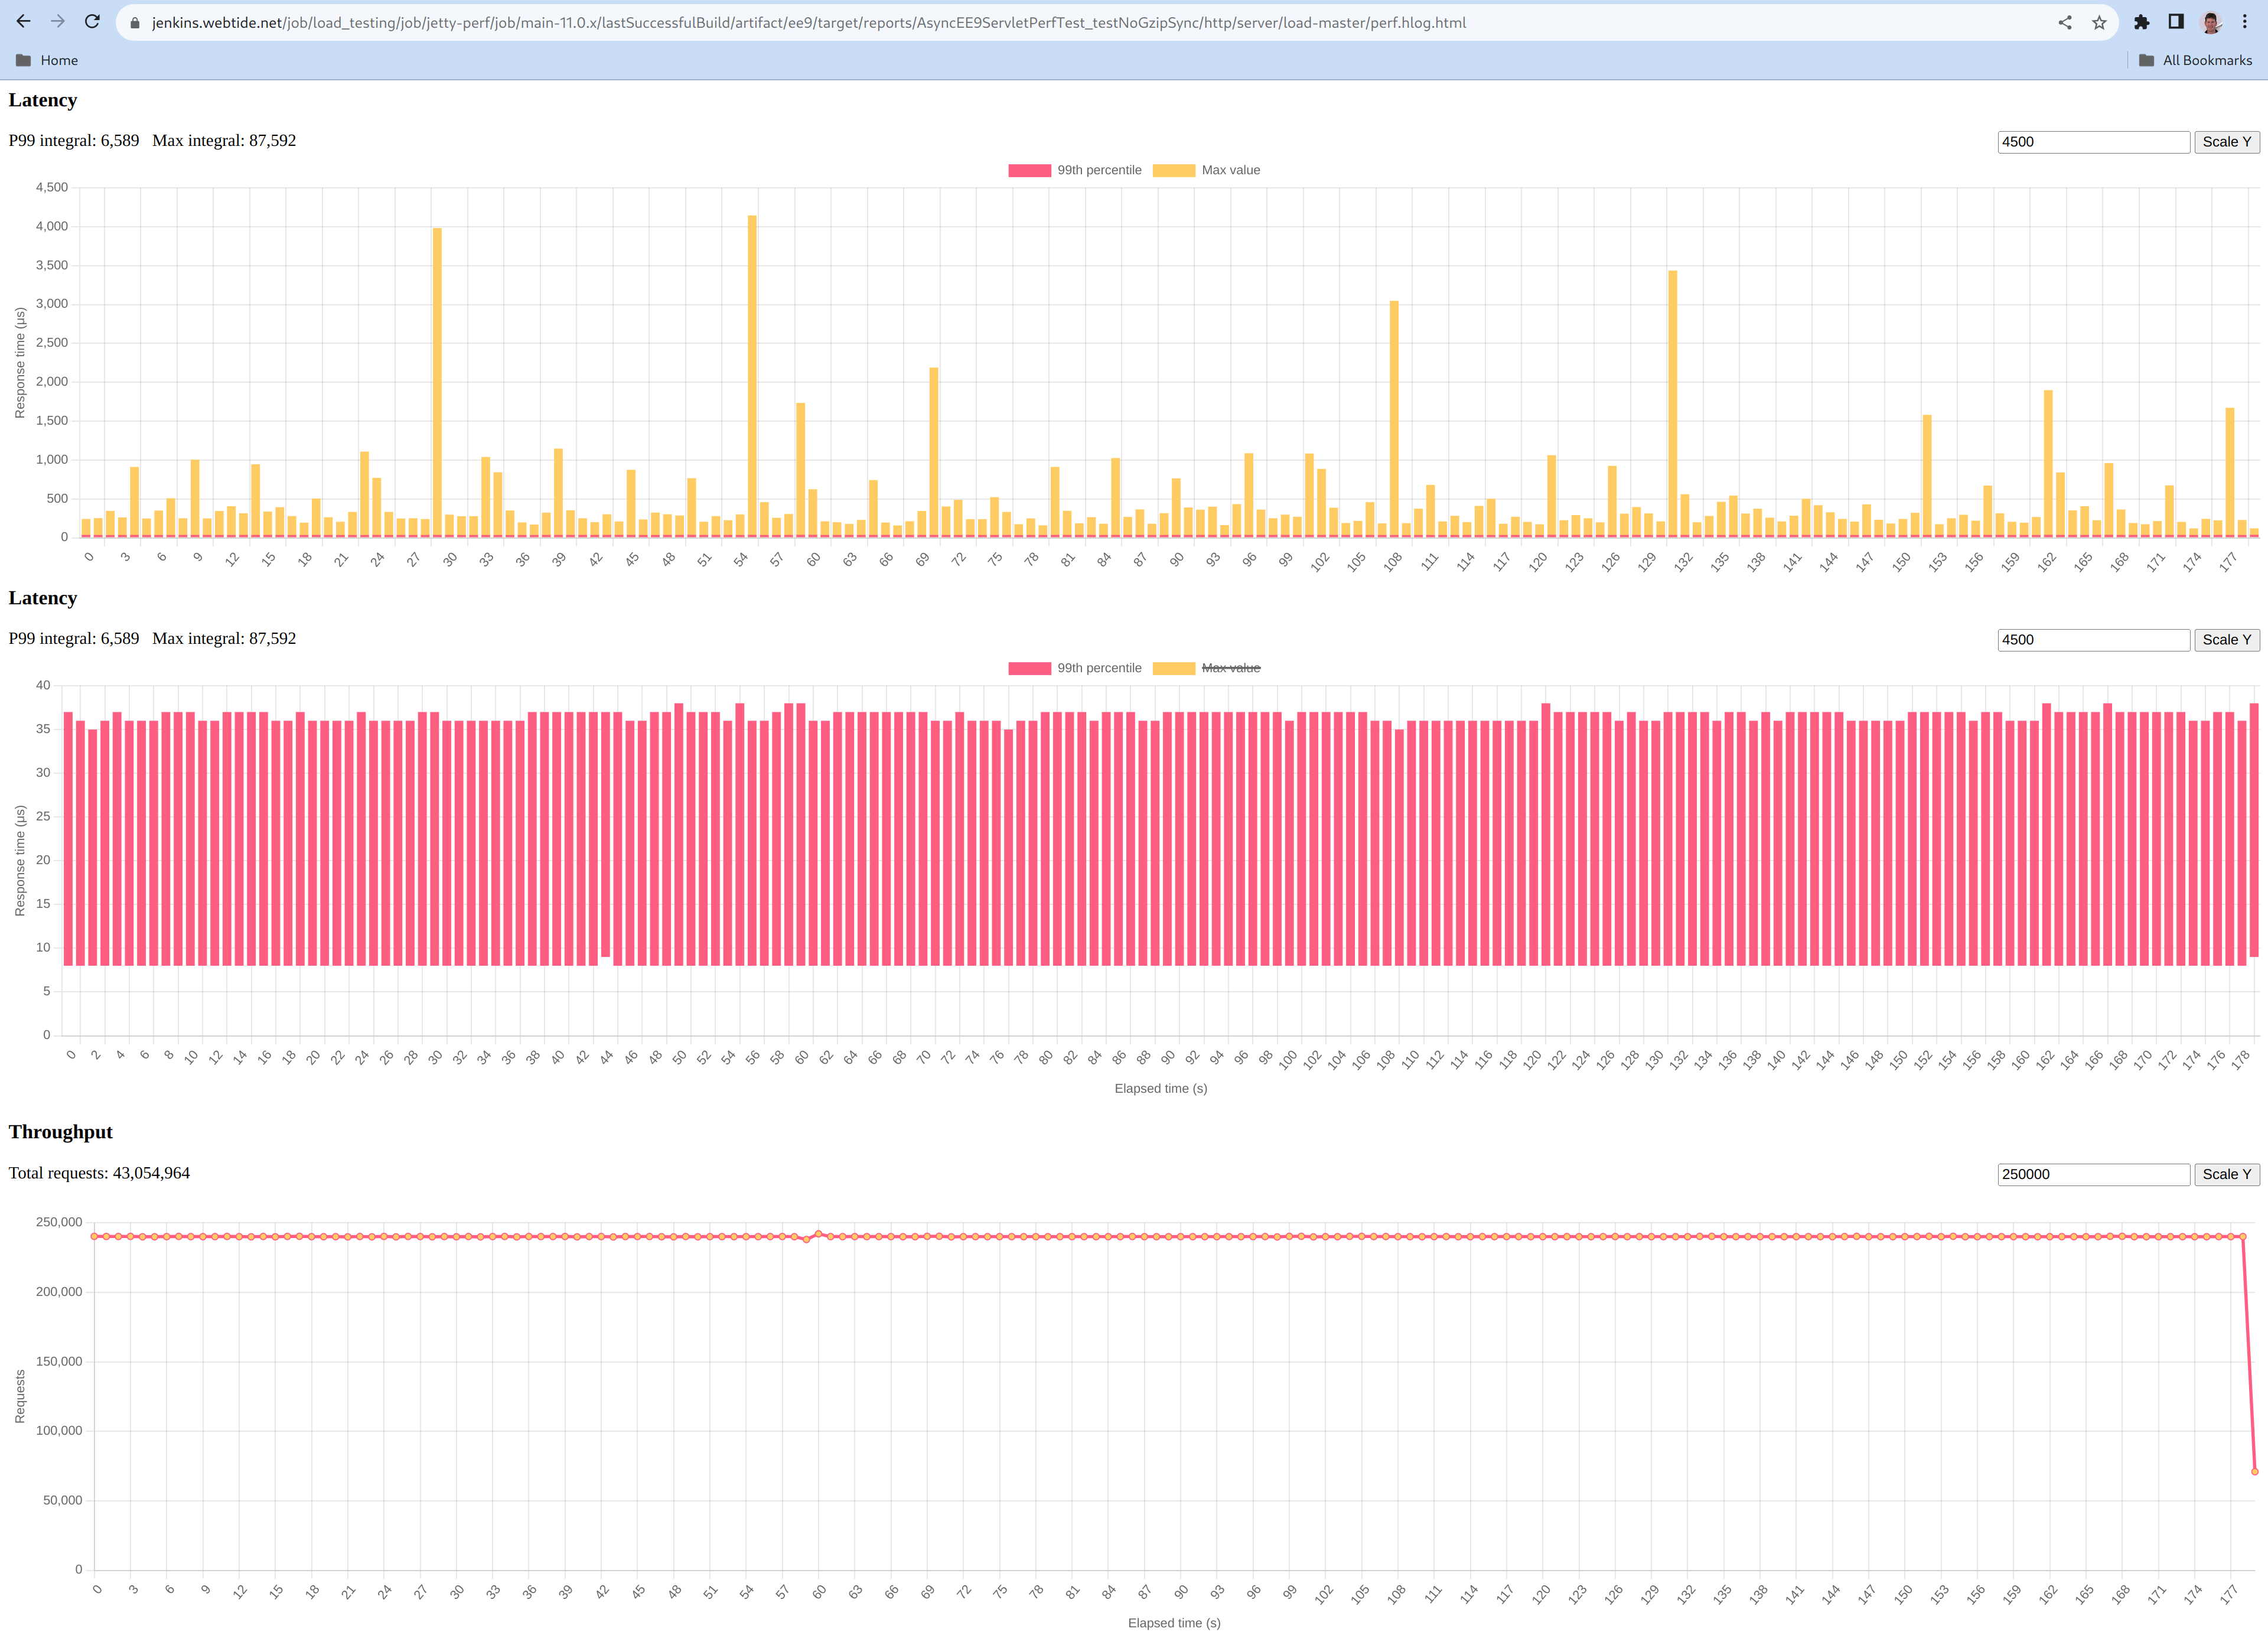
    With the CometD benchmark modified to not use ThreadLocal, we can now take Loom/Jetty/CometD to a moderate number of clients (1000 which generated the flame graph above) with the following results:

    CLIENT: Async Jetty/CometD server
    ========================================
    Testing 1000 clients in 100 rooms, 10 rooms/client
    Sending 1000 batches of 10x50 bytes messages every 10000 µs
    Elapsed = 10015 ms
    - - - - - - - - - - - - - - - - - - - -
    Outgoing: Rate = 990 messages/s - 99 batches/s - 12.014 MiB/s
    Incoming: Rate = 99829 messages/s - 35833 batches/s(35.89%) - 26.352 MiB/s
                    @     _  3,898 µs (112993, 11.30%)
                       @  _  7,797 µs (141274, 14.13%)
                       @  _  11,696 µs (136440, 13.65%)
                       @  _  15,595 µs (139590, 13.96%) ^50%
                       @  _  19,493 µs (142883, 14.29%)
                      @   _  23,392 µs (130493, 13.05%)
                    @     _  27,291 µs (112283, 11.23%) ^85%
            @             _  31,190 µs (59810, 5.98%) ^95%
      @                   _  35,088 µs (12968, 1.30%)
     @                    _  38,987 µs (4266, 0.43%) ^99%
    @                     _  42,886 µs (2150, 0.22%)
    @                     _  46,785 µs (1259, 0.13%)
    @                     _  50,683 µs (910, 0.09%)
    @                     _  54,582 µs (752, 0.08%)
    @                     _  58,481 µs (567, 0.06%)
    @                     _  62,380 µs (460, 0.05%) ^99.9%
    @                     _  66,278 µs (365, 0.04%)
    @                     _  70,177 µs (232, 0.02%)
    @                     _  74,076 µs (82, 0.01%)
    @                     _  77,975 µs (13, 0.00%)
    @                     _  81,873 µs (2, 0.00%)
    Messages - Latency: 999792 samples
    Messages - min/avg/50th%/99th%/max = 209/15,095/14,778/35,815/78,184 µs
    Messages - Network Latency Min/Ave/Max = 0/14/78 ms
    SERVER: Async Jetty/CometD server
    ========================================
    Operative System: Linux 5.8.0-33-generic amd64
    JVM: Oracle Corporation OpenJDK 64-Bit Server VM 16-ea+25-1633 16-ea+25-1633
    Processors: 12
    System Memory: 89.26419% used of 31.164349 GiB
    Used Heap Size: 73.283676 MiB
    Max Heap Size: 2048.0 MiB
    - - - - - - - - - - - - - - - - - - - -
    Elapsed Time: 10568 ms
       Time in Young GC: 5 ms (2 collections)
       Time in Old GC: 0 ms (0 collections)
    Garbage Generated in Eden Space: 3330.0 MiB
    Garbage Generated in Survivor Space: 4.227936 MiB
    Average CPU Load: 397.78314/1200
    ========================================
    Jetty Thread Pool:
        threads:                174
        tasks:                  302146
        max concurrent threads: 34
        max queue size:         152
        queue latency avg/max:  0/11 ms
        task time avg/max:      1/3316 ms


    CLIENT: Loom Jetty/CometD server
    ========================================
    Testing 1000 clients in 100 rooms, 10 rooms/client
    Sending 1000 batches of 10x50 bytes messages every 10000 µs
    Elapsed = 10009 ms
    - - - - - - - - - - - - - - - - - - - -
    Outgoing: Rate = 990 messages/s - 99 batches/s - 13.774 MiB/s
    Incoming: Rate = 99832 messages/s - 41201 batches/s(41.27%) - 27.462 MiB/s
                     @    _  2,718 µs (99690, 9.98%)
                       @  _  5,436 µs (116281, 11.64%)
                       @  _  8,155 µs (115202, 11.53%)
                       @  _  10,873 µs (108572, 10.87%)
                      @   _  13,591 µs (106951, 10.70%) ^50%
                       @  _  16,310 µs (117139, 11.72%)
                       @  _  19,028 µs (114531, 11.46%)
                    @     _  21,746 µs (94080, 9.42%) ^85%
                @         _  24,465 µs (71479, 7.15%)
          @               _  27,183 µs (34358, 3.44%) ^95%
      @                   _  29,901 µs (11526, 1.15%) ^99%
     @                    _  32,620 µs (4513, 0.45%)
    @                     _  35,338 µs (2123, 0.21%)
    @                     _  38,056 µs (988, 0.10%)
    @                     _  40,775 µs (562, 0.06%)
    @                     _  43,493 µs (578, 0.06%) ^99.9%
    @                     _  46,211 µs (435, 0.04%)
    @                     _  48,930 µs (187, 0.02%)
    @                     _  51,648 µs (31, 0.00%)
    @                     _  54,366 µs (27, 0.00%)
    @                     _  57,085 µs (1, 0.00%)
    Messages - Latency: 999254 samples
    Messages - min/avg/50th%/99th%/max = 192/12,630/12,476/29,704/54,558 µs
    Messages - Network Latency Min/Ave/Max = 0/12/54 ms
    SERVER: Loom Jetty/CometD server
    ========================================
    Operative System: Linux 5.8.0-33-generic amd64
    JVM: Oracle Corporation OpenJDK 64-Bit Server VM 16-loom+9-316 16-loom+9-316
    Processors: 12
    System Memory: 88.79622% used of 31.164349 GiB
    Used Heap Size: 61.733116 MiB
    Max Heap Size: 2048.0 MiB
    - - - - - - - - - - - - - - - - - - - -
    Elapsed Time: 10560 ms
       Time in Young GC: 23 ms (8 collections)
       Time in Old GC: 0 ms (0 collections)
    Garbage Generated in Eden Space: 8068.0 MiB
    Garbage Generated in Survivor Space: 3.6905975 MiB
    Average CPU Load: 413.33084/1200
    ========================================
    Jetty Thread Pool:
        threads:                14
        tasks:                  0
        max concurrent threads: 0
        max queue size:         0
        queue latency avg/max:  0/0 ms
        task time avg/max:      0/0 ms
    

    The results here are a bit mixed, but there are some positives for Loom:

    • Both approaches easily achieved the 1000 msg/s sent to the server and 99.8k msg/s received from the server (messages have an average fan-out of a factor 100).
    • The Loom version broke up those messages into 41k responses/s whilst the async version used bigger batches at 35k responses/s, which each response carrying more messages. We need to investigate why, but we think Loom is faster at starting to run the task (no time in the thread pool queue, no time to “wake up” an idle thread).
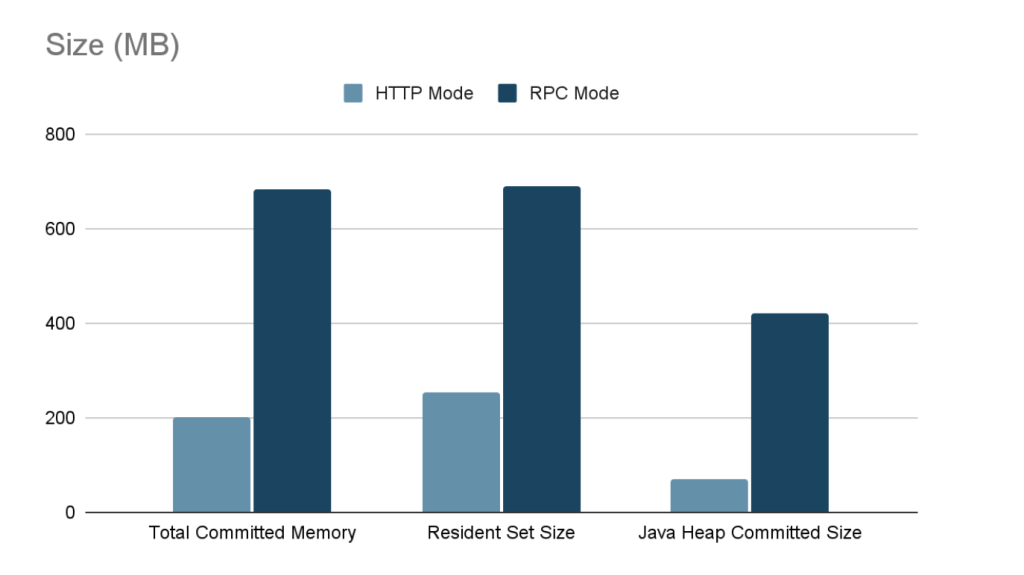
    • Loom had better latency, both average (~12.5 ms vs ~14.8 ms) and max (~54.6 ms vs ~78.2 ms)
    • Loom used more CPU: 413/1200 vs 398/1200 (4% more)
    • Loom generated more garbage: ~8068.0 MiB vs ~3330.0 MiB and less objects made it to survivor space.

    This is an interesting but inconclusive result.  It is at a low scale on a fast loopback network with a client unlikely to cause blocking, so not really testing either approach.  We now need to scale this test to many 10,000s of clients on a real network, which will require multiple load generation machines and careful measurement.  This will be the subject of part 3 (probably some weeks away).

    Conclusion (part 2) – Cheap threads can do expensive things

    It is good that Project Loom adds inexpensive and fast spawning/blocking virtual threads to the JVM.  But cheap threads can do expensive things!
    Having 1,000,000 concurrent application entities is going to take memory, CPU and other resources, no matter if they block or use async callbacks. It may be that entirely different programming styles are needed for Loom, as is suggested by Loom Structured Concurrency, however we have not yet seen anything that provides limitations on resources that can be used by unlimited spawning of virtual threads. There are also indications that Loom’s flexible stack management comes with a CPU cost.   However, it has been moderately simple to update Jetty to experiment with using Loom to call a blocking application and we’d very much encourage others to load test their application on the jetty-10.0.x-loom branch.
    Many of Loom’s claims have stacked up: blocking code is much easier to write, virtual threads are very fast to start and cheap to block. However, other key claims either do not hold up or have yet to be substantiated: we do not think virtual threads give natural scaling as threads themselves are not the limiting factor, rather it is the resources that are used that determines the scaling.  The suggestion to “Forget about thread-pools, just spawn a new thread…” feels like an invitation to create unstable applications unless other substantive resource management strategies are put into place.
    Given that Duke’s “new clothes” woven by Loom are not one-size-fits-all, it would be a mistake to stop developing asynchronous APIs for things such as DNS and JDBC on the unsubstantiated suggestion that Loom virtual threads will make them unnecessary.

  • Do Loom’s Claims Stack Up? Part 1: Millions of Threads?

    “Project Loom aims to drastically reduce the effort of writing, maintaining, and observing high-throughput concurrent applications that make the best use of available hardware. … The problem is that the thread, the software unit of concurrency, cannot match the scale of the application domain’s natural units of concurrency — a session, an HTTP request, or a single database operation. …  Whereas the OS can support up to a few thousand active threads, the Java runtime can support millions of virtual threads. Every unit of concurrency in the application domain can be represented by its own thread, making programming concurrent applications easier. Forget about thread-pools, just spawn a new thread, one per task.” – Ron Pressler, State of Loom, May 2020

    Project Loom brings virtual threads (back) to the JVM in an effort to reduce the effort of writing high-throughput concurrent applications. Loom has generated a fair bit of interest with claims that Asynchronous APIs may no longer be necessary for things like Futures, JDBC, DNS, Reactive, etc. So since Loom is now available in OpenJDK 16 early access includes, we thought it was a good time to test out some of the amazing claims that have been made for Duke‘s new opaque clothing that has been woven by Loom!  Spoiler – Duke might not be naked, but its attire could be a tad see-through!
    All the code from this blog is available in our loom-trial project and has been run on my dev machine (Intel® Core™ i7-6820HK CPU @ 2.70GHz × 8, 32GB memory,  Ubuntu 20.04.1 LTS 64-bit, OpenJDK Runtime Environment (build 16-loom+9-316)) with no specific tuning and default settings unless noted otherwise. 

    Some History

    We started writing what would become Eclipse Jetty in 1995 on Java 0.9.  For its first decade, Jetty was a blocking server using a thread per request and then a thread per connection, and large thread pools (sometimes many thousands) were sufficient to handle almost all the loads offered.
    However, there were a few deployments that wanted more parallelism, plus the advent of virtual hosting meant that servers were often sharing physical machines with other server instances, all trying to pre-allocate max resources in their idle thread pools to handle potential load spikes.
    Thus there was some demand for async and so Jetty-6 in 2006 introduced some asynchronous I/O. Yet it was not until Jetty-9 in 2012 that we could say that Jetty was fully asynchronous through the container and to the application and we still fight with the complexity of it today.
    Through this time, Java threads were initially implemented by Green Threads and there were lots of problems of live lock, priority inversion, etc. It was a huge relief when native threads were introduced to the JVM and thus we were a little surprised at the enthusiasm expressed for Loom, which appears to be a revisit of late-stage MxN Green Threads and suffers from at least some similar limitations (e.g. the CPUBound test demonstrates that the lack of preemption makes virtual tasks unsuitable for CPU bound tasks). This paper from 2002 on Multithreading in Solaris gives an excellent background on this subject and describes the switch from the MxN threading to 1:1 native threads with terms like “better scalability”, “simplicity”, “improved quality” and that MxN had “not quite delivered the anticipated benefits”. Thus we are really interested to find out what is so different this time around.
    The Jetty team has a near-unique perspective on the history of both Java threading and the development of highly concurrent large throughput Java applications, which we can use to evaluate Loom. It’s almost like we were frozen in time for decades to bring back our evil selves from the past 🙂

    One Million Threads!

    That’s a lot of threads and it is a claim that is really easy to test!  Here is an extract from MaxVThreads:

    CountDownLatch hold = new CountDownLatch(1);
    while (threads.size() < 1_000_000)
    {
        CountDownLatch started = new CountDownLatch(1);
        Thread thread = Thread.builder().virtual().task(() ->
        {
            try
            {
                started.countDown();
                hold.await();
            }
            catch (InterruptedException e)
            {
                e.printStackTrace();
            }
        }).start();
        threads.add(thread);
        started.await();
        System.err.printf("%s: %,d%n", thread, threads.size());
    }

    Which we ran and got:

    ...
    VirtualThread[@244165d6,...]:   999,998
    VirtualThread[@6f40da3b,...]:   999,999
    VirtualThread[@1cfca01c,...]: 1,000,000

    Async is Dead!!!
    Long live Loom!!!
    Lunch is Free!!!
    Bullets are Silver!!!
    (more…)

  • Object Pooling, Benchmarks, and Another Way

    Context

    The Jetty HTTP client internally uses a connection pool to recycle HTTP connections, as they are expensive to create and dispose of. This is a well-known pattern that has proved to work well.
    While this pattern brings great benefits, it’s not without its shortcomings. If the Jetty client is used by concurrent threads (like it’s meant to be) then one can start seeing some contention building up onto the pool as it is a central point that all threads have to go to to get a connection.
    Here’s a breakdown of what the client contains:

    HttpClient
      ConcurrentMap<Origin, HttpDestination>
    Origin
      scheme
      host
      port
    HttpDestination
      ConnectionPool
    

    The client contains a Map of Origin -> HttpDestination. The origin basically describes where the remote service is and the destination is a wrapper for the connection pool with bells and whistles.
    So, when you ask the client to do a GET on https://www.google.com/abc the client will use the connection pool contained in the destination keyed by “https|www.google.com|443”. Asking the client to GET https://www.google.com/xyz would make it use the exact same connection pool as the origins of both URLs are the same. Asking the same client to also do a GET on https://www.facebook.com/ would make it use a different connection pool as the origin this time around is “https|www.facebook.com|443”.
    It is quite common for a client to exchange with a handful, or sometimes even a single destination so it is expected that if multiple threads are using the client in parallel, they will all ask the same connection pool for a connection.
    There are three important implementations of the ConnectionPool interface:
    DuplexConnectionPool is the default. It guarantees that a connection will never be shared among threads, i.e.: when a connection is acquired by one thread, no other thread will be able to acquire it for as long as it hasn’t been released. It also tries to maximize re-use of the connections such as only a minimal amount of connections have to be kept open.
    MultiplexConnectionPool This one allows up to N threads (N being configurable) to acquire the exact same connection. While this is of no use for HTTP/1 connections as HTTP/1.1 does not allow running concurrent requests, HTTP/2 does so when the Jetty client connects to an HTTP/2 server; a single connection can be used to send multiple requests in parallel. Just like DuplexConnectionPool, it also tries to maximize the re-use of connections.
    RoundRobinConnectionPool Similar MultiplexConnectionPool as it allows multiple threads to share the connections. But unlike it, it does not try to maximize the re-use of connections. Instead, it tries to spread the load evenly across all of them. It can be configured to not multiplex the connections so that it can also be used with HTTP/1 connections.

    The Problem on the Surface

    Some users are heavily using the Jetty client with many concurrent threads, and they noticed that their threads were bottlenecked in the code that tries to get a connection from the connection pool. A quick investigation later revealed the problem comes from the fact that the connection pool implementations all use a java.util.Deque protected with a java.util.concurrent.locks.ReentrantLock. A single lock + multiple threads makes it rather obvious why this bottlenecks: all threads are contending on the lock which is easily provable with a simple microbenchmark ran under a profiler.
    Here is the benchmarked code:

    @Benchmark
    public void testPool()
    {
      Connection connection = pool.acquire(true);
      Blackhole.consumeCPU(ThreadLocalRandom.current().nextInt(10, 20));
      pool.release(connection);
    }
    

    And here is the report of the benchmark, running on a 12 cores CPU with 12 parallel threads and 12 connections in the pool:

    Benchmark                                 (POOL_TYPE)   Mode  Cnt        Score         Error  Units   CPU
    ConnectionPoolsBenchmark.testPool              duplex  thrpt    3  3168609.140 ± 1703378.453  ops/s   15%
    ConnectionPoolsBenchmark.testPool           multiplex  thrpt    3  2284937.900 ±  191568.815  ops/s   15%
    ConnectionPoolsBenchmark.testPool         round-robin  thrpt    3  1403693.845 ±  219405.841  ops/s   25%
    

    It was quite apparent that while the benchmark was running, the reported CPU consumption never reached anything close to 100% no matter how many threads were configured to use the connection pool in parallel.

    The Problem in Detail

    There are two fundamental problems. The most obvious one is the lock that protects all access to the connection pool. The second is more subtle, it’s the fact that a queue is an ill-suited data structure for writing performant concurrent algorithms.
    To be more precise: there are excellent concurrent queue algorithms out there that do a terrific job, and sometimes you have no choice but to use a queue to implement your logic correctly. But when you can write your concurrent code with a different data structure than a queue, you’re almost always going to win. And potentially win big.
    Here is an over-simplified explanation of why:

    Queue
    head           tail
    [c1]-[c2]-[c3]-[c4]
    c1-4 are the connection objects.
    

    All threads dequeue from the head and enqueue at the bottom, so that creates natural contention on these two spots. No matter how the queue is implemented, there is a natural set of data describing the head that must be read and modified concurrently by many threads so some form of mutual exclusion or Compare-And-Set retry loop has to be used to touch the head. Said differently: reading from a queue requires modifying the shape of the queue as you’re removing an entry from it. The same is true when writing to the queue.
    Both DuplexConnectionPool and MultiplexConnectionPool exacerbate the problem because they use the queue as a stack: the re-queuing is performed at the top of the queue as these two implementations want to maximize usage of the connections. RoundRobinConnectionPool mitigates that a bit by dequeuing from the head and re-queuing at the tail to maximize load spreading over all connections.

    The Solution

    The idea was to come up with a data structure that does not need to modify its shape when a connection is acquired or released. So instead of directly storing the connections in the data structure, let’s wrap it in some metadata holder object (let’s call its class Entry) that can tell if the connection is in use or not. Let’s pick a base data structure that is quick and easy to iterate, like an array.
    All threads iterate the array and try to reserve the visited connections up until one can be successfully reserved. The reservation is done by trying to flip the flag atomically which isn’t retried as a failure meaning you
    need to try the next connection. Because of multiplexing, the free/in-use flag actually has to be a counter that can go from 0 to configured max multiplex.

    Array
    [e1|e2|e3|e4]
     a1 a2 a3 a4
     c1 c2 c3 c4
    e1-4 are the Entry objects.
    a1-4 are the "acquired" counters.
    c1-4 are the connection objects.
    

    Both DuplexConnectionPool and MultiplexConnectionPool still have some form of contention as they always start iterating at the array’s index 0. This is unavoidable if you want to maximize the usage of connections.
    RoundRobinConnectionPool uses an atomic counter to figure out where to start iterating. This relieves the contention on the first elements in the array at the expense of contending on the atomic counter itself.
    The results of this algorithm are speaking for themselves:

    Benchmark                                 (POOL_TYPE)   Mode  Cnt         Score         Error  Units   CPU
    ConnectionPoolsBenchmark.testPool              duplex  thrpt    3  15661516.143 ±  104590.027  ops/s  100%
    ConnectionPoolsBenchmark.testPool           multiplex  thrpt    3   6172145.313 ±  459510.509  ops/s  100%
    ConnectionPoolsBenchmark.testPool         round-robin  thrpt    3  15446647.061 ± 3544105.965  ops/s  100%
    

    Clearly, this time we’re using all the CPU cycles we can. And we get 3 times more throughput for the multiplex pool, 5 times for the duplex pool, and 10 times for the round-robin pool.
    This is quite an improvement in itself, but we can still do better.

    Closing the Loop

    The above explanation describes the core algorithm that the new connection pools were built upon. But this is a bit of an over-simplification as reality is a bit more complex than that.

    • Entries count can change dynamically. So instead of an array, a CopyOnWriteArrayList is used so that entries can be added or removed at any time while the pool is being used.
    • Since the Jetty client creates connections asynchronously and the pool enforces a maximum size, the mechanism to add new connections works in two steps: reserve and enable, plus a counter to track the pending connections, i.e.: those that are reserved but not yet enabled. Since it is not expected that adding or removing connections is going to happen very often, the operations that modify the CopyOnWriteArrayList happen under a lock to simplify the implementation.
    • The pool provides a feature with which you can set how many times a connection can be used by the Jetty client before it has to be closed and a new one opened. This usage counter needs to be updated atomically with the multiplexing counter which makes the acquire/release finite state machine more complex.

    Extra #1: Caching

    There is one extra step we can take that can improve the performance of the duplex and multiplex connection pools even further. In an ideal case, there are as many connections in the pool as there are threads using them. What if we could make the threads stick to the same connection every time? This can be done by storing a reference to the successfully acquired connection into a thread-local variable which could then be reused the next time(s) a connection is acquired. This way, we could bypass both the iteration of the array and contention on the “acquired” counters. Of course, life isn’t always ideal so we would still need to keep the iteration and the counters as a fallback in case we drift away from the ideal case. But the closer the usage of the pool would be from the ideal case, the more this thread-local cache would avoid iterations and contention on the counters.
    Here are the results you get with this extra addition:

    Benchmark                                 (POOL_TYPE)   Mode  Cnt         Score           Error  Units   CPU
    ConnectionPoolsBenchmark.testPool       cached/duplex  thrpt    3  65338641.629 ±  42469231.542  ops/s  100%
    ConnectionPoolsBenchmark.testPool    cached/multiplex  thrpt    3  64245269.575 ± 142808539.722  ops/s  100%
    

    The duplex pool is over four times faster again, and the multiplex pool over 10 times faster. Again, the benchmark reflects the ideal case so this is really the best one can get but these improvements are certainly worth considering some tuning of the pool to try to get as much of those multipliers as possible.

    Extra #2: Iteration strategy

    All this logic has been moved to the org.eclipse.jetty.util.Pool class so that it can be re-used across all connection pool implementations, as well as potentially for pooling other objects. A good example is the server’s XmlConfiguration parser that uses expensive-to-create XML parsers. Another example is the Inflater and Deflater classes that are expensive to instantiate but are heavily used for compressing/decompressing requests and responses. Both are great candidates to pool objects and already are, using custom never-reused pooling code.
    So we could replace those two pools with the new pool created for the Jetty client’s HTTP connection pool. Except that none of those need to maximize re-use of the pooled objects, and they don’t need to rotate through them either, so none of the two iterations discussed above do the proper job, and both come with some overhead.
    Hence, StrategyType was introduced to tell the pool from where the iteration should start:

    public enum StrategyType
    {
     /**
      * A strategy that looks for an entry always starting from the first entry.
      * It will favour the early entries in the pool, but may contend on them more.
      */
      FIRST,
     /**
      * A strategy that looks for an entry by iterating from a random starting
      * index. No entries are favoured and contention is reduced.
      */
      RANDOM,
     /**
      * A strategy that uses the {@link Thread#getId()} of the current thread
      * to select a starting point for an entry search. Whilst not as performant as
      * using the {@link ThreadLocal} cache, it may be suitable when the pool is substantially smaller
      * than the number of available threads.
      * No entries are favoured and contention is reduced.
      */
      THREAD_ID,
     /**
      * A strategy that looks for an entry by iterating from a starting point
      * that is incremented on every search. This gives similar results to the
      * random strategy but with more predictable behaviour.
      * No entries are favoured and contention is reduced.
      */
      ROUND_ROBIN,
    }
    

    FIRST being the one used by duplex and multiplex connection pools and ROUND_ROBIN the one used, well, by the round-robin connection pool. The two new ones, RANDOM and THREAD_ID, are about spreading the load across all entries like ROUND_ROBIN, but unlike it, they use a cheap way to find that start index that does not require any form of contention.

  • Eat What You Kill without Starvation!

    Jetty 9 introduced the Eat-What-You-Kill[n]The EatWhatYouKill strategy is named after a hunting proverb in the sense that one should only kill to eat. The use of this phrase is not an endorsement of hunting nor killing of wildlife for food or sport.[/n] execution strategy to apply mechanically sympathetic techniques to the scheduling of threads in the producer-consumer pattern that are used for core capabilities in the server. The initial implementations proved vulnerable to thread starvation and Jetty-9.3 introduced dual scheduling strategies to keep the server running, which in turn suffered from lock contention on machines with more than 16 cores.  The Jetty-9.4 release now contains the latest incarnation of the Eat-What-You-Kill scheduling strategy which provides mechanical sympathy without the risk of thread starvation in a single strategy.  This blog is an update of the original post with the latest refinements.

    Parallel Mechanical Sympathy

    Parallel computing is a “false friend” for many web applications. The textbooks will tell you that parallelism is about decomposing large tasks into smaller ones that can be executed simultaneously by different computing engines to complete the task faster. While this is true, the issue is that for web application containers there is not an agreement on what is the “large task” that needs to be decomposed.

    From the applications point of view the large task to be solved is how to render a complex page for a user, combining multiple requests and resources, using many services for authentication and perhaps RESTful access to a data model on multiple back end servers. For the application, parallelism can improve quality of service of rendering a single page by spreading the decomposed tasks over all the available CPUs of the server.

    However, a web application container has a different large task to solve: how to provide service to hundreds or thousands, maybe even hundreds of thousands of simultaneous users. Unfortunately, for the container, the way to optimally allocate its this decomposed task to CPUs is completely opposite to how the application would like it’s decomposed tasks to be executed.

    Consider a server with 4 CPUs serving 4 users each which each have 4 tasks. The applications ideal view of parallel decomposition looks like:

    Label UxTy represent Task y for User x. Tasks for the same user are coloured alike

    This view suggests that each user’s combined task will be executed in minimum time. However some users must wait for prior users tasks to complete before their execution can start, so average latency is higher.

    Furthermore, we know from Mechanical Sympathy that such ideal execution is rarely possible, especially if there is data shared between tasks. Each CPU needs time to load its cache and register with data before it can be acted on. If that data is specific to the problem each user is trying to solve, then the real view of the parallel execution looks more like the following, the orange blocks indicating the time taken to load the CPU cache with user and task related data:

    Label UxTy represent Task y for User x. Tasks for the same user are coloured alike. Orange blocks represent cache load time.

    So from the containers point of view, the last thing it wants is the data from one users large problem spread over all its CPUs, because that means that when it executes the next task, it will have a cold cache and it must be reloaded with the data of the next user.  Furthermore, executing tasks for the same user on different CPUs risks Parallel Slowdown, where the cost of mutual exclusion, synchronisation and communication between CPUs can increase the total time needed to execute the tasks to more than serial execution.  If the tasks are fully mutually excluded on user data (unlikely but a bounding case), then the execution could look like:

    For optimal execution from the containers point of view it is far better if tasks from each user, which use common data, are kept on the same CPU so the cache only needs to be loaded once and there is no mutual exclusion on user data:

    While this style of execution does not achieve the minimal latency and throughput of the idealised application view, in reality it is the fairest and most optimal execution, with all users receiving similar quality of service and the optimal average latency.

    In summary, when scheduling the execution of parallel tasks, it is best to keep tasks that share data on the same CPU so that they may benefit from a hot cache (the original blog contains some micro benchmark results that quantifies the benefit).

    Produce Consume (PC)

    In order to facilitate the decomposition of large problems into smaller ones, the Jetty container uses the Producer-Consumer pattern:

    • The NIO Selector produces IO events that need to be consumed by reading, parsing and handling the data.
    • A multiplexed HTTP/2 connection produces Frames that need to be consumed by calling the Servlet Container. Note that the producer of HTTP/2 frames is itself a consumer of IO events!

    The producer-consumer pattern adds another way that tasks can be related by data. Not only might they be for the same user, but consuming a task will share the data that results from producing the task. A simple implementation can achieve this by using only a single CPU to both produce and consume the tasks:

    while (true)
    {
      Runnable task = _producer.produce();
      if (task == null)
        break;
       task.run();
    }

    The resulting execution pattern has good mechanical sympathy characteristics:

    Label UxPy represent Produce Task y for User x, Label UxCy represent Consume Task y for User x. Tasks for the same user are coloured in similar tones. Orange blocks are cache load times.

    Here all the produced tasks are immediately consumed on the same CPU with a hot cache!  Cache load times are minimised, but the cost is that server will suffer from Head of Line (HOL) Blocking, where the serial execution of task from a queue means that execution of tasks are forced to wait for the completion of unrelated tasks.  In this case tasks for U1C0 need not wait for U0C0 and U2C0 tasks need not wait for U1C1 or U0C1 etc. There is no parallel execution and thus this is not an optimal usage of the server resources.

    Produce Execute Consume (PEC)

    To solve the HOL blocking problem, multiple CPUs must be used so that produced tasks can be executed in parallel and even if one is slow or blocks, the other CPU can progress the other tasks.  To achieve this, a typical solution is to have one Thread executing on a CPU that will only produce tasks, which are then placed in a queue of tasks to be executed by Threads running on other CPUs.   Typically the task queue is abstracted into an Executor:

    while (true)
    {
        Runnable task = _producer.produce();
        if (task == null)
            break;
        _executor.execute(task);
    }

    This strategy could be considered the canonical solution to the producer consumer problem, where producers are separated from consumers by a queue and is at the heart of architectures such as SEDA. This strategy well solves the head of line blocking issue, since all tasks produced can complete independently in different Threads on different CPUs:

    This represents a good improvement in throughput and average latency over the simple Produce Consume, solution, but the cost is that every consumed task is executed on a different Thread (and thus likely a different CPU) from the one that produced the task.  While this may appear like a small cost for avoiding HOL blocking, our experience is that CPU cache misses significantly reduced the performance of early Jetty 9 releases.

    Eat What You Kill (EWYK) AKA Execute Produce Consume (EPC)

    To achieve good mechanical sympathy and avoid HOL blocking, Jetty has developed the Execute Produce Consume strategy, that we have nicknamed Eat What You Kill (EWYK) after the expression which states a hunter should only kill an animal they intend to eat. Applied to the producer consumer problem this policy says that a thread should only produce (kill) a task if it intends to consume (eat) it[n]The EatWhatYouKill strategy is named after a hunting proverb in the sense that one should only kill to eat. The use of this phrase is not an endorsement of hunting nor killing of wildlife for food or sport.[/n]. A task queue is still used to achieve parallel execution, but it is the producer that is dispatched rather than the produced task:

        while (true)
        {
            Runnable task = _producer.produce();
            if (task == null)
                break;
            _executor.execute(this); // dispatch production
            task.run(); // consume the task ourselves
        }

    The result is that a task is consumed by the same Thread, and thus likely the same CPU, that produced it, so that consumption is always done with a hot cache:

    Moreover, because any thread that completes consuming a task will immediately attempt to produce another task, there is the possibility of a single Thread/CPU executing multiple produce/consume cycles for the same user. The result is improved average latency and reduced total CPU time.

    Starvation!

    Unfortunately, a pure implementation of EWYK suffers from a fatal flaw! Since any thread producing a task will go on to consume that task,  it is possible for all threads/CPU to be consuming at once.   This was initially seen as a feature as it exerted good back pressure on the network as a busy server used all its resources consuming existing tasks rather than producing new tasks. However, in an application server consuming a task may be a blocking process that waits for more data/frames to be produced. Unfortunately if every thread/CPU ends up consuming such a blocking task, then there are no threads left available to produce the tasks to unblock them. Dead lock!

    A real example of this occurred with HTTP/2, when every Thread from the pool was blocked in a HTTP/2 request because it had used up its flow control window. The windows can be expanded by flow control frames from the other end, but there were no threads available to process the flow control frames!

    Thus the EWYK execution strategy used in Jetty is now adaptive and it can can use the most appropriate of the three strategies outlined above, ensuring there is always at least one thread/CPU producing so that starvation does not occur. To be adaptive, Jetty uses two mechanisms:

    • Tasks that are produced can be interrogated via the Invocable interface to determine if they are nonblocking, blocking or can be run in either mode.  NON_BLOCKING or EITHER tasks can be directly consumed by PC model.
    • The thread pools used by Jetty implement the TryExecutor interface which supports the method boolean tryExecute(Runnable task)which allows the scheduler to know if a thread was available to continue producing and thus allows EWYK/EPC mode, otherwise the task must be passed to an executor to be consumed in PEC mode.  To implement this semantic, Jetty maintains a dynamically sized pool of reserved threads that can respond to tryExecute(Runnable)calls.

    Thus the simple produce consume (PC) model is used for non-blocking tasks; for blocking tasks the EWYK, aka Execute Produce Consume (EPC) mode is used if a reserved thread is available, otherwise the SEDA style Produce Execute Consume (PEC) model is used.

    The adaptive EWYK strategy can be written as :

        while (true)
        {
            Runnable task = _producer.produce();
            if (task == null)
                break;
            if (Invocable.getInvocationType(task)==NON_BLOCKING)
                task.run();                     // Produce Consume
            else if (executor.tryExecute(this)) // recruit a new producer?
                task.run();                     // Execute Produce Consume (EWYK!)
            else
                executor.execute(task);         // Produce Execute Consume
        }
    

    Chained Execution Strategies

    As stated above, in the Jetty use-case it is common for the execution strategy used by the IO layer to call tasks that are themselves an execution strategy for producing and consuming HTTP/2 frames.  Thus EWYK strategies can be chained and by knowing some information about the mode in which the prior  strategy has executed them the strategies can be even more adaptive.

    The adaptable chainable EWYK strategy is outlined here:

      while (true) {
        Runnable task = _producer.produce();
        if (task == null)
          break;
        if (thisThreadIsNonBlocking())
        {
          switch(Invocable.getInvocationType(task))
          {
            case NON_BLOCKING:
              task.run();                 // Produce Consume
              break;
            case BLOCKING:
              executor.execute(task);     // Produce Execute Consume
              break;
            case EITHER:
              executeAsNonBlocking(task); // Produce Consume break;
           }
        }
        else
        {
          switch(Invocable.getInvocationType(task))
          {
            case NON_BLOCKING:
              task.run();                   // Produce Consume
              break;
            case BLOCKING:
              if (_executor.tryExecute(this))
                task.run();                 // Execute Produce Consume (EWYK!)
              else
                executor.execute(task);     // Produce Execute Consume
              break;
            case EITHER:
              if (_executor.tryExecute(this))
                task.run();                 // Execute Produce Consume (EWYK!)
              else
                executeAsNonBlocking(task); // Produce Consume
                break;
           }
        }

    An example of how the chaining works is that the HTTP/2 task declares itself as invocable EITHER in blocking on non blocking mode. If IO strategy is operating in PEC mode, then the HTTP/2 task is in its own thread and free to block, so it can itself use EWYK and potentially execute a blocking task that it produced.

    However, if the IO strategy has no reserved threads it cannot risk queuing an important Flow Control frame in a job queue. Instead it can execute the HTTP/2 as a non blocking task in the PC mode.  So even if the last available thread was running the IO strategy, it can use PC mode to execute HTTP/2 tasks in non blocking mode. The HTTP/2 strategy is then always able to handle flow control frames as they are non-blocking tasks run as PC and all other frames that may block are queued with PEC.

    Conclusion

    The EWYK execution strategy has been implemented in Jetty to improve performance through mechanical sympathy, whilst avoiding the issues of Head of Line blocking, Thread Starvation and Parallel Slowdown.   The team at Webtide continue to work with our clients and users to analyse and innovate better solutions to serve high performance real world applications.

  • Fast MultiPart FormData

    Jetty’s venerable MultiPartInputStreamParser for parsing MultiPart form-data has been deprecated and replaced by the much more efficient MultiPartFormInputStream, based on a new MultiPartParser. This is much faster, but less forgiving of non-compliant format. So we have implemented a legacy mode to access the old parser, but with enhancements to make logging of compliance violations possible.

    Benchmarks

    We have achieved an order of magnitude speed-up in the parsing of large uploaded content and even small content is significantly faster.
    We performed a JMH benchmark of the (new) HTTP MultiPartFormInputStream vs the (old) UTIL MultiPartInputStreamParser. Our tests were:

    • testLargeGenerated:  parses a 10MB file of random binary data
    • testParser:  parses a series of small multipart forms captured by a browser

    Our results clearly show that the new multipart processing is superior in terms of speed to the old processing:

    # Run complete. Total time: 00:02:09
    Benchmark                              (parserType)  Mode  Cnt  Score   Error  Units
    MultiPartBenchmark.testLargeGenerated          UTIL  avgt   10  0.252 ± 0.025   s/op
    MultiPartBenchmark.testLargeGenerated          HTTP  avgt   10  0.035 ± 0.004   s/op
    MultiPartBenchmark.testParser                  UTIL  avgt   10  0.028 ± 0.005   s/op
    MultiPartBenchmark.testParser                  HTTP  avgt   10  0.015 ± 0.006   s/op
    

    How To Use

    By default in Jetty 9.4, the old MultiPartInputStreamParser will be used. The default will be switched to the new MultiPartInputStreamParser in jetty-10.  To use the new parser (available since release 9.4.10)  you can change the compliance mode in the server.ini file so that it defaults to using RFC7578 instead of the LEGACY mode.

    ## multipart/form-data compliance mode of: LEGACY(slow), RFC7578(fast)
    # jetty.httpConfig.multiPartFormDataCompliance=LEGACY

    This feature can also be used programmatically by setting the compliance mode through the HttpConfiguration instance which can be obtained through the HttpConnectionFactory in the connector.

    connector.getConnectionFactory(HttpConnectionFactory.class).getHttpConfiguration()
    .setMultiPartFormDataCompliance(MultiPartFormDataCompliance.RFC7578);
    

    Compliance Modes

    There are now two compliance modes for MultiPart form parsing:

    • LEGACY mode which uses the old MultiPartInputStreamParser in jetty-util, this will be slower but more forgiving in accepting formats that are non-compliant with RFC7578.
    • RFC7578 mode which uses the new MultiPartFormInputStream in jetty-http, this will perform faster than the LEGACY mode, however, there may be issues in receiving badly formatted MultiPart forms that were previously accepted.

    The default compliance mode is currently LEGACY, however, this will be changed to RFC7578 a future release.

    Legacy Mode Compliance Warnings

    When the old MultiPartInputStreamParser accepts a format non-compliant with the RFC, a violation is recorded as an attribute in the request. These violations include:

    The list of violations as Strings can be obtained from the request by accessing the attribute  HttpCompliance.VIOLATIONS_ATTR.

    (List<String>)request.getAttribute(HttpCompliance.VIOLATIONS_ATTR);

    Each violation string gives the name of the violation followed by a link to the RFC describing that particular violation.
    Here’s an example:
    CR_LINE_TERMINATION: https://tools.ietf.org/html/rfc2046#section-4.1.1
    NO_CRLF_AFTER_PREAMBLE: https://tools.ietf.org/html/rfc2046#section-5.1.1

    The Future

    The parser is async capable, so expect further innovations with non-blocking uploads and possibly reactive parts.